Time Management Statistics Everyone Should Know in 2024 (And Beyond)

How many times have you wished for a day to last longer?
Yet, statistics show that we spend almost 3 hours per day scrolling through social media.
Since social media may not be the only culprit for our lack of time, we need to get to the bottom of where exactly the rest of our time goes.
That's why we've compiled the ultimate list of time management statistics — to help you understand the impact of time management on your personal and professional life, and achieve a balance between the two.
KEY TAKEAWAYS
- Employees spend 57% of their time communicating — managing emails, attending meetings, and responding to messages using a team chat app.
- 50% of employees consider chatty coworkers as their top distraction at work.
- 21.7% of leaders work 60 hours per week or more.
- 60% of CEOs see the time spent on administrative tasks as wasted.
- An average person spends around 7 hours a day online.
- Social media users spend 2 hours and 30 minutes scrolling.
- 10% of our time goes to housework each day.
- Women tackle 58% of all household chores every day.
- 75% of students struggle with procrastination.
- Outsourcing chores to save time could increase your happiness to the same extent as receiving $18,000.
Statistics on time management at work
When it comes to business, the saying "Time is money" can be applied at all times. Therefore, productivity and adequate task prioritization are arguably the key aspects of success.
Let's walk a mile each in both employees' and employers' shoes and see how exactly we all manage our time at work to reach maximum productivity.
Time management statistics for employees
The way employees spend their time at work may not always be up to them. From having to attend dozens of meetings, to addressing burning issues — employees from all over the world have to put in constant effort to actually manage their time well.
Let’s see what the numbers say.
Employees spend almost 5 hours per day communicating
Exploring their users’ workday habits, a Microsoft study discovered that employees spend around 57% of their time at work communicating. This amounts to 4 hours and 33 minutes spent managing emails, attending meetings, and communicating via the team chat app.
If we look at these numbers in more detail, that’s:
- 1 hour and 12 minutes spent on emails,
- 1 hour and 31 minutes spent in the team chat app, and
- 1 hour and 50 minutes spent in meetings.
All this time spent communicating amounts to a month and a half of the total work days per year spent in constant communication.
Considering the numbers, it’s no surprise that 68% of surveyed employees claim that they don’t have enough time to dedicate their attention to what truly matters — uninterrupted deep work.
How to manage email productivity: Tips from Patty Kreamer, a professional organizer
81% of remote workers check their emails outside of office hours
Bringing work home or working overtime is a common problem that affects one's mental health and leads to burnout.
In addition to burnout, working beyond the clock can also trigger further complications in other life aspects, such as:
- Interpersonal relationships,
- Social life,
- Time for hobbies, and
- Self-improvement time.
So arguably, the whole point of perfecting time management is to achieve the ideal work-life balance.
Yet, Buffer’s most recent State Of Remote Work report shows that 81% of remote workers regularly respond to emails despite their work hours being long over.
Onsite workers, however, do not differ that much from their work-from-home counterparts. In fact, 76% of office workers report checking their work email in the after hours, too.
Chatty coworkers are the most common distraction at work
US employees lose more than 6 hours per week to different distractions, as the new Workamajig survey shows.
The research also shows that almost 90% of US workers deal with distractions at least once per day.
Chatty colleagues come first, as the all-time-winning distraction among office workers.
Internet browsing, office noise, and social media are also listed as the most common focus disruptors.
| 1. Chatty coworkers | For 50% of respondents |
| 2. Internet browsing | For 35% of respondents |
| 3. Office noise | For 25% of respondents |
| 4. Social media | For 15% of respondents |
| 5. Background noise | For 15% of respondents |
Effects of workplace distractions in 2023: Crucial statistics
In the US, the average time at work per year is 1,892 hours
Due to various cultural, geopolitical, and economic factors, different regions have different standards of what counts as a regular workload per week.
For this reason, the average number of hours people work varies by country and is the lowest in Uruguay — 1,284 hours per year or 24.6 hours per week on average.
Some other countries with working weeks on the lower end are:
- Austria — 1,534 hours per year,
- France — 1,565 hours per year, and
- The Netherlands — 1,627 hours per year.
On the other hand, the one with the highest average is the United Arab Emirates with a worrying 2,704 hours per year. The US is somewhere in between, with an average of 1,892 hours.
As you can see, developing time management skills depends on the region as well, as cultural values and the very perception of time differ.
So, two people with the exact same time management skills will be perceived differently in different parts of the world.
How Many Work Hours Do You Work in a Year?
90% of employees see flexible work arrangements as a top priority
A fixed schedule may be beneficial, but not for everyone. For example, many people with young children find the 9-to-5 schedule problematic and prefer starting earlier.
That's why 90% of employees identify flexible work arrangements as one of the most relevant factors when considering a job offer, according to the latest Gitnux report on flexible work.
There is an abundance of benefits that come with flexible working hours and, because of that, a great number of employees still expect at least some level of flexibility at work.
It's no wonder, especially if we take into account the availability of time management apps that can help both employers and employees get and stay organized.
10 Fast Ways to Improve Employee Productivity in the Workplace
50% of employees do not feel engaged at work
Now let's check out how negative emotions (such as anger, sadness, worry, and stress) impact our work, according to Gallup's most recent research.
33% of US employees report being actively engaged in their work, whereas only 23% of global employees consider themselves engaged and enthusiastic about their workplace.
Consequently, 50% of US employees reported being actively disengaged from their work, a.k.a. quiet quitting.
As the Gallup report shows, low engagement and the subsequent productivity loss are estimated to cost the US economy as much as $1.9 trillion.
Workplace culture surely matters here, but it's also up to employees to be proactive and start measuring their productivity and efficiency.
Time management statistics for business owners
From making the most of their work hours to leveraging the power of automation, leaders from all over the world unite in one simple goal — making sure their efforts count.
Let’s see where business owners stand with time management on their road to success.
21.7% of leaders work more than 60 hours a week
Have you heard the saying there's no rest for the wicked? Evidently, it applies to business owners, too.
According to the Zipdo report on entrepreneurial burnout, 21.7% of business owners work 60 hours per week or more, whereas a whopping 89% of entrepreneurs see their workload as too heavy.
All things considered, it shouldn’t come as a surprise that 72% of leaders feel burnt out as they bring their workday to an end, according to the Global Leadership Forecast from 2023.
The burnout the majority of leaders experience testifies to the fact that even the ones who work shorter hours are not immune to exhaustion. In fact, as the Global Leadership Forecast shows, 44.7% of entrepreneurs report regular feelings of exhaustion, whereas 67% regularly push through the exhaustion and continue working.
Although the numbers do not specifically pinpoint to a lack of proper time management, they testify to the excessive workload leaders usually handle — out of which at least a portion could be delegated.
By handing over tasks that don't require direct supervision, leaders not only free up their schedule but also foster a culture of ownership where each individual contributing to the company feels engaged and performs better.
Leaders who don’t take a break from work hurt their leading performance
On top of constantly being on the brink of burnout, leaders who don't unplug from work risk draining their mental resources, which, in turn, hurts their capacity to lead.
Moreover, a research published in the Journal of Applied Psychology has shown that leaders who engage in ruminating about work in their after-hours have a harder time identifying as a leader the next day.
One solution for preventing work from creeping into the after-hours would be to try and complete as much as possible while still at work so the boundary between leadership responsibilities and personal life remains intact.
Different time management methods, such as timeboxing or Eisenhower matrix can do the trick here. In fact, neuroscientific research has shown that reducing cognitive overload by making a plan and prioritizing our tasks can help us achieve more and unwind when the day's over.
50% of team collaboration happens in team messaging apps
Buffer’s report on the state of remote work shows that 50% of all team collaboration takes place in a messaging app.
The second most used tool for cross-team communication is email, with 22% of communication happening within the email inbox.
Meetings come third — 19% of all team collaboration happens during a virtual call.
Lastly, only a portion of collaboration happens via shared documents — 7%.
The report also touches on working across multiple time zones — which is among the top struggles workers from anywhere usually have.
Yet, 75% of remote workers claim they feel connected to their colleagues despite the physical distance. Considering the number of remote workers who use messaging apps to collaborate, the connection shouldn’t come as a surprise.
This information could be particularly relevant to business owners planning to transition to remote work.
In fact, as Microsoft’s most recent Work Trend Index Special Report shows, clear and timely communication significantly impacts employee retention. So, knowing where the team collaboration happens in the most efficient way can only benefit organizations in the long run — both in terms of time management and employee satisfaction.
60% CEOs think time spent on administrative tasks is inefficient
Even though payroll processes, performance reviews, and emails are necessary operational tasks for each business, that still doesn’t mean they aren’t slowing down other high-value tasks.
60% of 4,702 surveyed CEOs participating in PwC’s Annual Global CEO Survey confirm this viewpoint, stating that 40% of the time spent on routine tasks is inefficient.
Yet, automating repetitive processes could be part of the solution, especially time-wise. In fact, around 40% of businesses surveyed for the Future of Work report claim they intend to automate at least a portion of their company’s repetitive tasks, such as allocation of tasks and document processing.
Processing payroll and invoicing also ranks high on the scale of time-eating processes. Therefore it’s only logical that an increasing number of business owners either intend to or have already handed over these tasks to payroll apps.
How Clockify gives Flobotics a competitive edge in the RPA industry
Statistics on time management and free time
We get around 5 hours of leisure time per day, according to the Our World in Data Time Use Survey. Yet, not each of those 300 minutes of free time is always spent intentionally, which may affect our happiness levels even though we’re free from work.
Let’s take a look at the numbers in more detail and see exactly how we manage our free time.
Statistics about time management and the Internet
The World Wide Web can be an amazing resource for improvement and learning.
However, we've all encountered wasting too much time browsing, streaming, or scrolling through our social media feeds, right?
Without a proper time management system, it's getting harder to avoid various distractions by the day.
That's mostly due to digital technology, which has contributed to a significant decrease in our attention spans.
More specifically, the 2 factors that enable being online at all times, thus leading to us being more easily distracted are:
- Highly increased availability of smart devices, and
- High-speed internet connection.
The average daily time a person spends online is close to 7 hours
An average person spends 6 hours and 40 minutes online, as the most recent Digital 2024 Global Overview Report shows.
Since 66.3% of the world’s population are regular internet users, it’s safe to say that around 5 billion people spend at least 20% of their daily time online.
Yet, the number of active users continues to rise. In fact, when compared to the beginning of the year, the end of 2023 marked 97 million more internet users.
The penetration rate of internet users is the highest in Northern Europe — incredible 97,6%, while it's lowest in Eastern Africa — only 26,7%.
Check out the top 10 list of territories with the highest penetration rate.
| RANKING | TERRITORY | PERCENTAGE |
|---|---|---|
| #1 | Northern Europe | 97.6% |
| #2 | Northern America | 96.8% |
| #3 | Western Europe | 94.5% |
| #4 | Southern Europe | 90.2% |
| #5 | Eastern Europe | 88.4% |
| #6 | Southern America | 82.5% |
| #7 | Central America | 78.8% |
| #8 | Oceania | 77.5% |
| #9 | Eastern Asia | 76.8% |
| #10 | Central Asia | 76.2% |
Internet users spend 5 hours per day online on their smartphones
Let's mention another prevailing source of distraction — our smartphones. The device has evolved as our screens have become larger and our internet connection better.
The Digital 2024 Global Overview Report we've mentioned above also reveals — a stunning 5.61 billion people use a mobile device, whereas 94.6% of internet users access the internet using a smartphone.
Surely, it’s only logical — smartphones and tablets are practical when we're on the go. The thing is, most of us don't use them only for relevant matters — nor only on the go.
In fact, the average daily time people spend online on their mobile devices is 5 hours.
Moreover, the average mobile connection speed reported was 48.61 Mbps for download and 11.07 Mbps for upload.
Before such high-speed connections, internet use was limited to the essentials, such as finding a phone number, an address, or checking our inbox. But now, when we can effortlessly stream our favorite TV shows on Netflix, it's become fairly easy to lose sight of our priorities.
An average social media user spends about 2 and a half hours per day scrolling
Digital 2024 Global Overview Report shows that one-third of our online time goes on social media. In fact, the average internet user spends around 2 hours and 23 minutes per day using social media platforms.
Considering that there are 5.04 billion active social media accounts around the world, it shouldn’t come as a surprise that we collectively spend 720 billion minutes per day on social media.
Yet, the striking number of minutes average internet users spend scrolling and chatting on a daily basis doesn’t include the time spent on entertainment platforms, such as YouTube and TikTok.
If we counted the average time spent on TikTok (34 hours/month) and YouTube (28 hours and 5 minutes/month), we’d get to an additional 62 hours and 5 minutes per month people spend consuming content online.
On top of the already mentioned 2 hours and 23 minutes/day spent on social media, this would amount to 4 hours and 5 minutes per day an average internet user loses to scrolling and video consumption.
Let’s see how global users spend their time on social media apps in more detail.
| RANKING | PLATFORM | AVERAGE TIME PER MONTH |
|---|---|---|
| #1 | TikTok | 34 hours |
| #2 | YouTube | 28 hours and 5 minutes |
| #3 | 19 hours and 47 minutes | |
| #4 | 17 hours and 6 minutes | |
| #5 | 15 hours and 50 minutes | |
| #6 | Line | 8 hours and 14 minutes |
| #7 | X (Twitter) | 4 hours and 40 minutes |
| #8 | Telegram | 3 hours and 45 minutes |
| #9 | Snapchat | 3 hours and 33 minutes |
| #10 | Facebook Messenger | 3 hours and 21 minutes |
| #11 | 1 hour and 49 minutes | |
| #12 | 51 minutes |
56.6% of internet users list staying in touch with family and friends among primary reasons of use
The data on primary reasons people use the Internet tells us a lot about intent, common behavior, and thus habits of internet users.
The list from the Digital 2024 Global Overview Report goes into more detail on the reasons for internet use.
| Primary reason | Percentage of internet users reporting |
|---|---|
| 1. Finding information | 60.9% |
| 2. Staying in touch with family and friends | 56.6% |
| 3. Watching videos, TV shows, and movies | 52.3% |
| 4. Keeping up to date with events and news | 51.9% |
| 5. “How to” research | 49.4% |
| 6. Getting inspired or finding new ideas | 46.1% |
| 7. Listening to music | 45.1% |
| 8. Research of brands and products | 43.7% |
| 9. General browsing and spending of free time | 42.6% |
| 10. Studying and education | 38.8% |
| 11. Research related to places and traveling | 37.9% |
| 12. Research on health matters and products | 35.2% |
| 13. Finance management | 34.2% |
| 14. Business-related research | 29.9% |
| 15. Gaming | 29.3% |
As you can see, time management statistics regarding our virtual presence point to education, business, and finance management, all being on the low end of the list. Ouch!
Moreover, you can also notice that not too many of the major reasons are considered productive.
Personal productivity guide: Maximize productivity with these methods and apps
Statistics about time management and sleep
Many aspects of time management are directly related to overall cultural differences, including the very perception of time.
However, one thing is evident, regardless of those different perceptions of time — the connection between getting enough sleep and happiness. It is proven in numerous studies, and the experts suggest that adults should get at least 7 hours of sleep.
But do we always sleep the recommended minimum number of hours?
Let’s see what the stats say.
People in Mexico sleep 9 hours per night on average
We all know that getting a good night's sleep can make a huge difference, and that’s not only time management-wise.
In fact, there's a correlation between feeling happy and getting enough sleep. The explanation is simple — people who are happy are less likely to indulge in mind-wandering activities (especially when they go to bed), and are more likely to be productive.
According to research by Zoma Sleep, people in Mexico get the most sleep per night — 9 hours.
In contrast, with a total of only 6 hours, people in Sweden sleep considerably less.
The US is somewhere in between, so there’s definitely room for improvement. The average time is 7 hours and 10 minutes per night.
Statistics about time management and housework
Much of our outside-of-work waking time goes to household chores. Yet, many factors impact the exact number of hours we devote to housework — including our country of residence and gender.
Let’s see how we tackle tasks around our homes.
10% of our time goes to housework
On average, we allocate 10% of our time each day to domestic chores such as cleaning, washing up, doing laundry, etc.
Yet, according to the previously mentioned Time Use Survey, the exact time people allocate to housework varies across countries.
For example, people in Mexico spend 3 hours and 18 minutes on a daily basis doing domestic chores.
South Korean citizens, on the other hand, allocate around 1 hour and 20 minutes per day to the same tasks.
The US yet again falls somewhere in between — an average US citizen spends roughly 2 hours per day cleaning, decluttering, and cooking.
Let’s take a look at the top 10 countries where people spend most of their free time engaged in household chores.
| COUNTRY | TIME |
|---|---|
| 1. Mexico | 3 hours and 18 minutes |
| 2. Portugal | 2 hours and 54 minutes |
| 3. Italy | 2 hours and 42 minutes |
| 4. India | 2 hours and 36 minutes |
| 5. Poland | 2 hours and 36 minutes |
| 6. Denmark | 2 hours and 30 minutes |
| 7. France | 2 hours and 30 minutes |
| 8. Belgium | 2 hours and 24 minutes |
| 9. Austria | 2 hours and 24 minutes |
| 10. Germany | 2 hours and 18 minutes |
How to Declutter Your Digital Space
Women do 58% of domestic work
Even though we spend a great deal of our time trying to keep up with chores, women still allocate a larger portion of their days to household work than men.
In fact, as the Gender Inequality in Unpaid Domestic Work Report that analyzed domestic labor chores division between partners has shown, women do 58% of all domestic work. Men, on the other hand, tackle 42% of household chores.
Women also allocate a greater portion of their time to cooking, spending 31.90% of the overall time reserved for chores in the kitchen. Their male partners, however, allocate only 17.40% of that time to meal preparation.
Let’s look at the Gender Inequality Report findings in more detail, and see how much time out of the total time reserved for household labor both genders spend tackling domestic work.
| TYPE OF CHORE | WOMEN | MEN |
|---|---|---|
| Meal preparation | 31.90% | 17.40% |
| House cleaning | 22.65% | 18.20% |
| Children’s care | 12.62% | 18.60% |
| Grocery shopping | 7.79% | 11.67% |
As the table shows, women do dedicate a significant amount of their time to household tasks. Yet, the CAKE.com Gender Inequality Report indicates that men spend a greater share of their time taking care of the kids and handling grocery shopping.
Statistics about time management and commuting
Did you know that an average US citizen spends 52.2 minutes per day commuting to work? This amounts to 10 days per year spent just moving from one place to another.
But what about the rest of the world?
Let’s look at the commuting data a bit closer.
Citizens of London lose 7 days per year to traffic congestion
Wherever you are in the world, you can’t avoid getting stuck in traffic every once in a while.
Yet, some citizens have it worse than others — losing hours per day stuck behind their wheels simply waiting for the traffic to move an inch.
London, for example, has come out on top of the list as one of the most congested cities in 2023 — with its citizens wasting 156 hours per year due to traffic congestion.
The rest of the world, unfortunately, does not fall that much behind London.
Let’s examine the list of 10 cities with the highest traffic delays.
| CITY | HOURS PER YEAR |
|---|---|
| 1. London | 156 hours |
| 2. Chicago | 155 hours |
| 3. Paris | 138 hours |
| 4. Boston | 134 hours |
| 5. Bogota | 132 hours |
| 6. Palermo | 121 hours |
| 7. Toronto | 118 hours |
| 8. New York City | 117 hours |
| 9. Monterrey | 116 hours |
| 10. Philadelphia | 114 hours |
Interesting facts about commuting
Statistics on time management for students
Effective time management matters in every stage of life, but it's especially relevant during high school and college.
Teenagers’ and young adults’ approach to organization and structure has a major impact on their overall growth and self-image.
Yet, are they always successful at managing their time well? Let’s find out.
Why a time tracker is a great tool for students and teachers
Statistics on students' time management skills
Despite being objectively easier for students to adopt habits, socialization and other fun activities can often be their priority during this period.
For that reason, a great number of students struggle with time management and frequently need help practicing time management skills.
Let’s see what it looks like in practice, exactly.
33% of college students need help with planning their schedule
It's proven that organizational skills are of the utmost importance for various aspects of life — especially when it comes to academic studies and later careers.
Precisely because of that, 33% of students believe that help with organizing their schedule would significantly improve their overall educational experience, as a college experience survey shows.
Moreover, as many as 32% of college students consider time management tips and workshops to be particularly useful for improving their time management abilities.
How to plan your day and stay organized
28.7% of students never write down their goals
It’s not a secret that putting our goals in writing increases our chances of achieving them. Such a simple action nudges us into taking actionable steps and being careful about how we spend our time.
This is especially the case with college students, who can increase their academic performance by 22% just by putting their goals in writing.
Yet, although as many as 62% of students rely on writing down their priorities, while 53% note their most important due dates — 28.7% never set to write down their goals.
As a consequence, they frequently end up with the time they aren’t sure how exactly to fill in, a heavy academic load, and increased stress levels.
Statistics on student procrastination
As we've seen earlier, the topic of procrastination is closely connected to time management skills.
Yet, academic procrastination is the subcategory specifically relevant for students. This phenomenon is defined as the delay in starting or finalizing an academic assignment, and it goes hand in hand with academic burnout.
Let’s take a look at how students deal with procrastination in more detail.
75% of students struggle with procrastination
Even though different studies point to different percentages, one thing is for sure — most college students procrastinate.
In fact, a recent study shows that as many as 75% of surveyed college students procrastinate on a regular basis, whereas 53% can be defined as severe procrastinators.
Now let's see why the tendency occurs.
A case study on student procrastination points to a combination of poor time management skills coupled with psychological inflexibility (inability to accept negative experiences and emotions) as a significant factor in academic procrastination.
58% of students submit the assignments within the last 24 hours of the deadline
Here, it seems appropriate to mention the saying: “Deadline is the best motivation.”
Regardless of how the students had used the time in between, when given a full week to complete a task, 58% submitted their task on the last day.
It’s all about self-regulation.
Further analysis of the results showed that the procrastinators also had significantly lower scores.
Those results show that 76% of students who submitted their assignments early got higher scores (A or B). On the other hand, this was the case for only 60% of the procrastinators.
There are several reasons why early submitters have higher performance:
- When any given task is divided into smaller segments, it’s easier to remain motivated and focused. Moreover, whenever a segment is completed, it is followed by a feeling of satisfaction.
- In most cases, the given tasks are related to parts of the curriculum that are still fresh in the students’ minds.
- There’s always room for improvement. If a student completes the task on day 3 and sleeps on it before submission, they might come up with an idea on how to make it better.
Interesting time management statistics and facts
Did you know that research has shown that spending money on time-saving activities such as allocating chores could make you as happy as if you’ve just received $18,000?
In the following segment, we’ll cover more interesting details and statistics regarding time management.
Countries with shorter working hours or a 4-day week have the happiest citizens
The data from the latest World Happiness Report published in 2023 shows that the truth is the opposite of popular but outdated beliefs about people living in Nordic countries.
The uncorroborated narrative claims that Nordic people are prone to depression and have the highest suicide rate.
However, that’s not the case, and the people living over there are actually thriving. As a matter of fact, the top 3 countries with the happiest citizens are Nordic.
The list of the top 3 countries with the highest satisfaction rate goes as follows:
- Finland,
- Denmark, and
- Iceland.
Additionally, it’s the Nordic countries that introduced numerous studies on the 4-day week that resulted in increased productivity and happiness among the employees.
For example, successful results from a trial in Iceland led to 86% of the country’s workforce either working shorter hours or gaining the right to do so in the near future.
Spending money on time makes people happier
The more time we save, the happier we are — and this shouldn’t come as a surprise.
However, research has shown that investing money in certain activities, such as paying someone to do your chores or go shopping instead of you, could actually improve your mood and increase your life satisfaction.
Ashley Whillans, one of the authors of the same research and the writer of the book Time Smart, has come up with a metric that actually gives our happiness a monetary value — the happiness dollar. This unit shows exactly how happy a certain activity could make you in dollars.
According to Whillans’ metric, allocating a certain amount of money to outsource chores can increase our happiness to the same extent as receiving $18,000.
So even though hiring someone to do an activity for us does not come without a cost, the satisfaction we receive from such an action is much greater — especially when converted into a monetary unit.
Over 350 genetic factors impact one’s cognitive ability during the day
Society as a whole is based on an early bird’s schedule, surely — but don’t stress too much if you’re a night owl.
Of course, the circadian rhythm is a matter of fact, but our internal clocks are complex and equally important. A study of genome-wide data of almost 700,000 participants proved that the reason is a variation in the chronotype of an individual.
The number of genetic factors that will determine when a person feels energized the most is 351.
So, it turns out that there’s no one-size-fits-all magic formula when it comes to proper time management, and we should plan our schedules in accordance with our internal clocks instead.
How I calculated my biological prime time
Allocate enough time to sleep to avoid several health conditions
On average, it’s estimated that people who complete all of the REM and non-REM stages during one night dream for 2 full hours.
This matters because dreaming helps people process and deal with their emotions. Admittedly, you don’t have to plan or schedule these hours, but this is just one more example of how a consistent sleep pattern benefits mental health.
Many studies focused on a regular sleep pattern and how the lack of it reflects badly on our physical and mental health. We’ll stick with a study that examined the impact of sleep deprivation on emotions and social interactions.
The results of the study underline the importance of getting enough sleep, showing that short sleepers are less likely to build intimate relationships, leading to them being more prone to emotional loneliness.
Yet, as the same study shows, despite the negative effects of short sleep, 30% of adults sleep less than 6 hours per night. This would entail that a great number of people have trouble in social contexts due to the changes in the connectivity of their brain networks caused by the lack of sleep.
So, given that our cognitive capabilities are highly dependent on sleep, it’s vital for our well-being to adequately allocate enough time to sleep and be consistent.
In 2015, the National Plan for Vacation Day was introduced in the US
Taking a vacation is just like planning your daily breaks — but on a larger scale.
Yet, PTO statistics show that more than 765 million vacation days remain unused in the US, and this has been going on for years.
That’s why the government decided to introduce an encouragement policy — National Plan for Vacation Day, which is celebrated in the US on the last Tuesday of January. Thousands of organizations nationwide use the day to inspire their employees for future getaways.
But why did the government want to encourage Americans to take their time off regularly?
Because the fact is affecting more than just one’s mental health — we’re talking about the economy.
As the travel industry amounts to 2.5% of the US National GDP and employs more than 15 million American workers, it’s not surprising that the US government decided to encourage its citizens to plan their time off and use their vacation time to travel.
PTO vs. Vacation: What Is the Difference?
Bonus: Time Management FAQs
Let’s check out the most common issues related to understanding the importance of time management by looking into 6 frequently asked questions that could help you get the big picture.
Is time management a life skill?
In short, yes, time management is a life skill.
But the topic is much more complex as time management is not really a single, but an array of various skills related to:
- Planning,
- Organization, and
- Execution of tasks.
Many people start managing their time in school in order to boost their productivity and efficiency in completing their academic tasks. And for the vast majority, it’s to prepare for further work responsibilities.
However, not too many understand it’s crucial to apply the same strategies and prioritize tasks in your personal life as well.
What are 3 reasons why time management is important?
The way we choose to allocate our time during the day is what shapes our personalities. Even the seemingly insignificant habits develop into routines and, eventually, the way of life.
There’s an abundance of reasons why taking control of your time matters for every aspect of your life, and here are the 3 main ones:
- Better work-life balance,
- Greater focus, and
- Higher levels of productivity.
Daily Routines and Habits of Successful People
What is the effectiveness of time management?
Effective time management refers to a unique skill set and thus differs for every individual.
In plain words, it means to work smarter, not harder.
Various tasks in our daily routine are mentally exhausting, while others wear us off physically.
To be effective a person should plan the order of those tasks in a way to be fully focused while doing them. We already know that the average person spends approximately one-third of their life sleeping, so it’s about leveraging every moment we’re awake to its full potential.
What are the benefits of time management?
First, there’s a direct correlation between time management and mental health — as being in charge of your own schedule boosts your confidence and self-image.
Showing up on time, meeting deadlines, and feeling focused and productive while at work further make other people respect you more.
So, as far as the benefits of time management, statistics point to a natural consequence — stress and anxiety levels being significantly reduced.
That way, time passes more smoothly, and your life starts operating like a well-oiled machine. The main result is thus a great work-life balance that we all strive for.
What is the best way to manage your time?
There are many proven strategies and techniques to improve your time management. However, due to the complexity of the concept and the diversity of our capabilities, there is no “one size fits all” approach.
The only constant rule is to monitor your performance and track your progress.
According to Harvard Business Review, to manage your time better, there are 3 main categories of skills to develop:
- Awareness,
- Arrangement, and
- Adaptation.
Bear in mind that it’s perfectly fine to experiment a bit until you find what works for you. Especially because, as technology advances, many digital solutions are available to help you do so.
From automation of various tasks and regular reminders to productivity tracking and reporting, these are just some of the features that will enhance your efforts.
How do you master time management?
According to Gladwell’s theory, it takes approximately 10,000 hours to master a complex skill. However, it’s difficult to talk about time management in that context, as the starting point is different for everyone.
But no worries, we can still point you in the right direction.
In gist, mastering time management means 3 things:
- Taking responsibility,
- Developing positive habits, and
- Being determined to improve.
The pace of our life changes as we mature, as well as the surrounding circumstances. It all comes down to our ability to adapt and, ultimately, learn to truly value the limited resource of time.
Track your way to time management mastery with Clockify
As the numbers have demonstrated, nobody’s quite perfect with managing their time.
Yet, most of the time, we struggle combating procrastination and distractions simply because we either lack the right approach or the right tools for managing our time better.
So, just by introducing a simple time tracker, such as Clockify, you could skip a few steps on the way to making the most of your most limited resource — time.
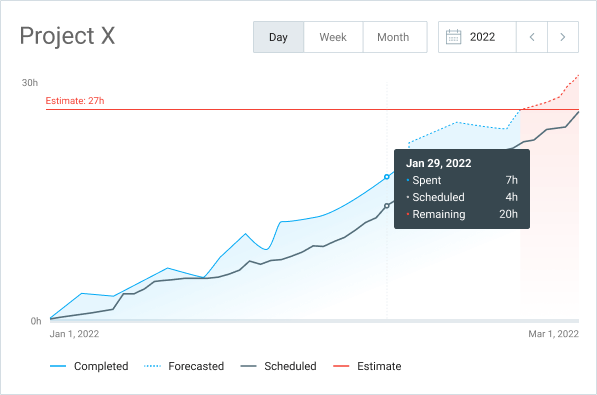
In fact, Clockify lets you track your work hours, stay on top of your tasks, and even make predictions on how long your projects may take.
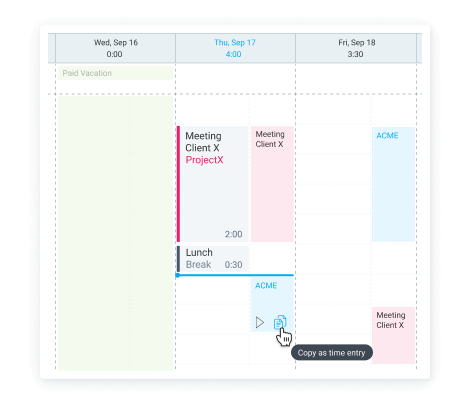
In addition to all that, Clockify lets you visualize your day, schedule events, and keep all your tasks under one roof by pairing it up with your Google or Outlook calendar.
References
- Alshutwi S., and others. (2020). The influence of time management skills on stress and academic performance level among nursing students. Journal of Nursing Education and Practice. https://doi.org/10.5430/jnep.v10n1p96
- Ashley V. Whillans. (2020). Time Smart: How to Reclaim Your Time and Live a Happier Life. Harvard Business Publishing.
- Ashley V. Whillans and others. (2017). Buying time promotes happiness. Proceedings of the National Academy of Sciences. vol.144. no. 32. https://www.pnas.org/doi/pdf/10.1073/pnas.1706541114
- Bragazzi, N. L., Garbarino, S., Puce, L., Trompetto, C., Marinelli, L., Currà, A., Jahrami, H., Trabelsi, K., Mellado, B., Asgary, A., Wu, J., & Kong, J. D. (2022). Planetary sleep medicine: Studying sleep at the individual, population, and planetary level. Frontiers in Public Health, 10. https://doi.org/10.3389/fpubh.2022.1005100
- Buffer. (2023). State Of Remote Work 2023. https://buffer.com/state-of-remote-work/2023
- Development Dimensions International. (2023). Global Leadership Forecast. https://www.ddiworld.com/global-leadership-forecast-2023/ceo-challenges
- Dierdorff, E.C. (2020). Time Management Is About More Than Life Hacks. Harvard Business Review. https://hbr.org/2020/01/time-management-is-about-more-than-life-hacks
- Forbes. (2024). Average PTO In The US & Other PTO Statistics (2024). https://www.forbes.com/advisor/business/pto-statistics/
- Gallup. (2023). Building Quality Jobs Through Ownership. https://www.gallup.com/workplace/544361/building-quality-jobs-ownership.aspx
- Gallup. (2024). In New Workplace, U.S. Employee Engagement Stagnates. https://www.gallup.com/workplace/608675/new-workplace-employee-engagement-stagnates.aspx
- Gitnub (2024). Must-Know Flexible Work Statistics. https://gitnux.org/flexible-work-statistics/
- Giurge L.M., & Bohns V. (2021). Be Intentional About How You Spend Your Time Off. Harvard Business Review. https://hbr.org/2021/12/be-intentional-about-how-you-spend-your-time-off
- Hailikari T. and others. (2021). Understanding procrastination: A case of a study skills course. Social psychology of education. Volume 24, pages 589–606. https://link.springer.com/article/10.1007/s11218-021-09621-2
- Helliwell, J. F. and others (2023). World Happiness Report 2023 | The World Happiness Report. https://happiness-report.s3.amazonaws.com/2023/WHR+23.pdf
- Herbert Smith Freehills (2023). Future of Work Report 2023. https://www.herbertsmithfreehills.com/insights/reports/future-of-work-report-2023
- Inrix. (2022). Global Traffic Scorecard. https://inrix.com/scorecard/
- Insider Higher Ed. (2023). So Little Time, Not Enough Help With Time Management? https://www.insidehighered.com/news/student-success/college-experience/2023/10/05/survey-students-want-help-time-management
- Jennings, R.E. and others. (2024). Want to Be a Better Leader? Stop Thinking About Work After Hours. Harvard Business Review. https://hbr.org/2024/01/want-to-be-a-better-leader-stop-thinking-about-work-after-hours
- Jones, I. S. (2020). ERIC - EJ1293903 - Year Two: Effect of Procrastination on Academic Performance of Undergraduate Online Students, Research in Higher Education Journal, 2021-Jan. https://eric.ed.gov/?id=EJ1293903
- Jones, S. E. (2019, January 29). Genome-wide association analyses of chronotype in 697,828 individuals provides insights into circadian rhythms. Nature. https://www.nature.com/articles/s41467-018-08259-7?error=cookies_not_supported&code=0fddc915-f35c-48f5-8c77-cf777af76f89
- Kemp, S. (2024). Digital 2024: Global Overview Report. DataReportal — Global Digital Insights. https://datareportal.com/reports/digital-2024-global-overview-report
- Lanaj K.G., and others. (2023). The importance of leader recovery for leader identity and behavior. American Psychology Association Journal. 108(10), 1717–1736. https://doi.org/10.1037/apl0001092
- Microsoft. (2023). 2023 Work Trend Index: Annual Report: Will AI Fix Work? https://www.microsoft.com/en-us/worklab/work-trend-index/will-ai-fix-work/
- Microsoft. (2023). The New Performance Equation in the Age of AI. https://www.microsoft.com/en-us/worklab/work-trend-index/the-new-performance-equation-in-the-age-of-ai/
- National Plan for Vacation Day. (n.d.). https://planforvacation.com/
- NeuroLeadership Institute. (2023). Time Management Isn’t What You Think. https://neuroleadership.com/your-brain-at-work/time-management-isnt-what-you-think
- Our World in Data. (2024). Time Use. https://ourworldindata.org/time-use
- Outliers: The Story of Success. (n.d.). Goodreads. https://www.goodreads.com/book/show/3228917-outliers
- PwC. (2024). PwC’s 27th Annual Global CEO Survey. https://www.pwc.com/gx/en/issues/c-suite-insights/ceo-survey.html
- Ridester. (2024). Average US Commute: How Much Waste Commuting in Your Lifetime (by City). https://www.ridester.com/average-us-commute/
- Rozental, A., & Carlbring, P. (2014). Understanding and Treating Procrastination: A Review of a Common Self-Regulatory Failure. Psychology, 05(13), 1488–1502. https://doi.org/10.4236/psych.2014.513160
- Sanfilippo, M. (2024). What After-Hours Emails Really Do to Your Employees. Business News Daily. https://www.businessnewsdaily.com/9241-check-email-after-work.html
- Schippers, M.C., and others (2020). Writing about personal goals and plans regardless of goal type boosts academic performance. Contemporary Educational Psychology. Volume 60. https://doi.org/10.1016/j.cedpsych.2019.101823
- Shanmugasundaram L., & Tamilarasu A. (2023). The impact of digital technology, social media, and artificial intelligence on cognitive functions: a review. Frontiers in Cognition. https://www.frontiersin.org/articles/10.3389/fcogn.2023.1203077/full
- Solan, M. (2023). How much sleep do you actually need? Harvard Health Publishing. https://www.health.harvard.edu/blog/how-much-sleep-do-you-actually-need-202310302986
- U.S. Travel Association (2023). Economic Impact of the U.S. Travel Industry. https://www.ustravel.org/sites/default/files/2024-03/National%20Data_0.pdf
- Workamajig. (2023). Top distractions at work killing productivity in 2023: Statistics. https://www.workamajig.com/project-management-software/top-distractions-at-work
- Yiqi Mi, Xu Lei (2022). Sleep loss and lack of social interaction: a summary interview. Brain-Apparatus Communication: A Journal of Bacomics. Volume 2, 2023 - Issue 1. https://www.tandfonline.com/doi/full/10.1080/27706710.2022.2163593
- Zipdo. (2024). Essential Entrepreneur Burnout Statistics In 2024. https://zipdo.co/statistics/entrepreneur-burnout/
- Zoma Sleep. (2024). Who’s getting the most sleep? https://zomasleep.com/blog/whos-getting-the-most-sleep