How to use the Monitoring Dashboard
O Monitoring Dashboard gives you a bird’s-eye view of your team’s work habits, helping you gain productivity insights based on computer activity and tool utilization. It provides visual breakdowns of active versus idle time, individual and group performance, and which applications and websites are being used most frequently.
Accessing the Dashboard #
To access the dashboard:
- Vá para a página Monitoring
- Selecione Painel
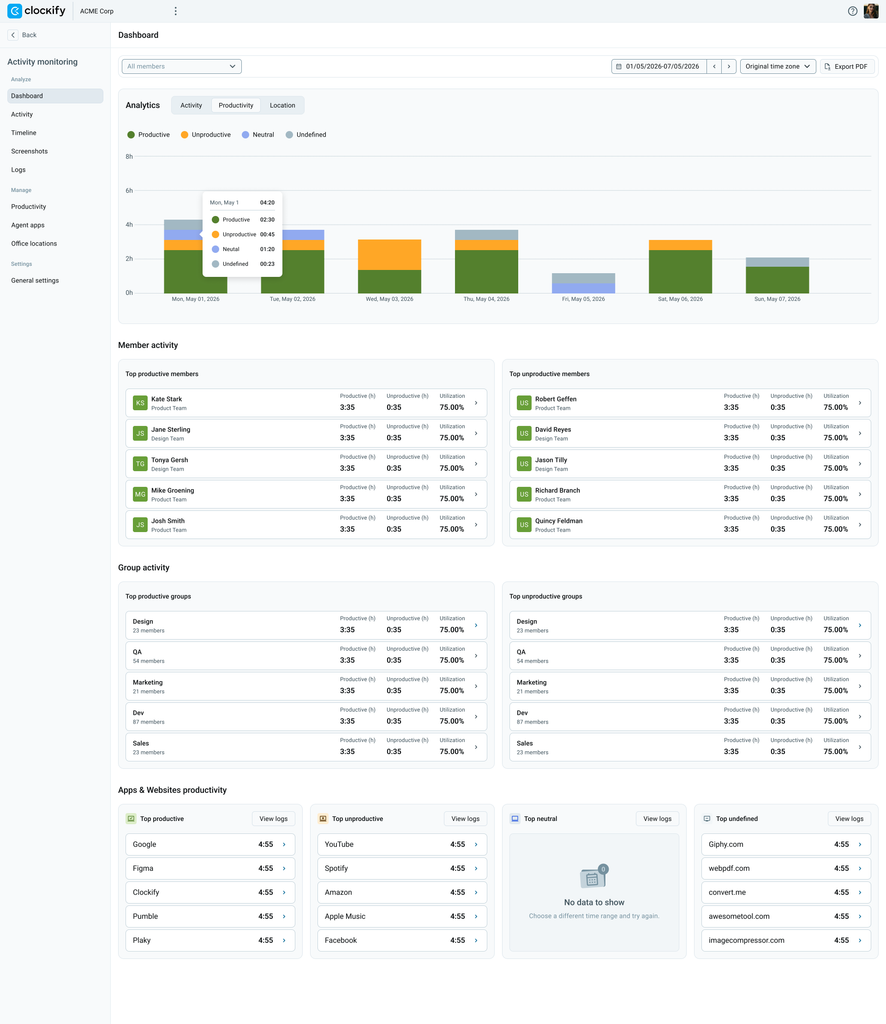
At the top right of the dashboard, you can:
- Filter by Date: Click the date range picker (e.g., 01/05/2026 – 07/05/2026) to view data for a specific day, week, or custom period.
- Adjust Time Zone: Use the time zone dropdown to switch between the Member time zone (Original zone) to view activity based on the employee’s local time, or the Viewer time zone (the default view) to convert all activity data to your local time zone.
Dashboard sections #
1. Analytics (Active vs. Idle Time) #
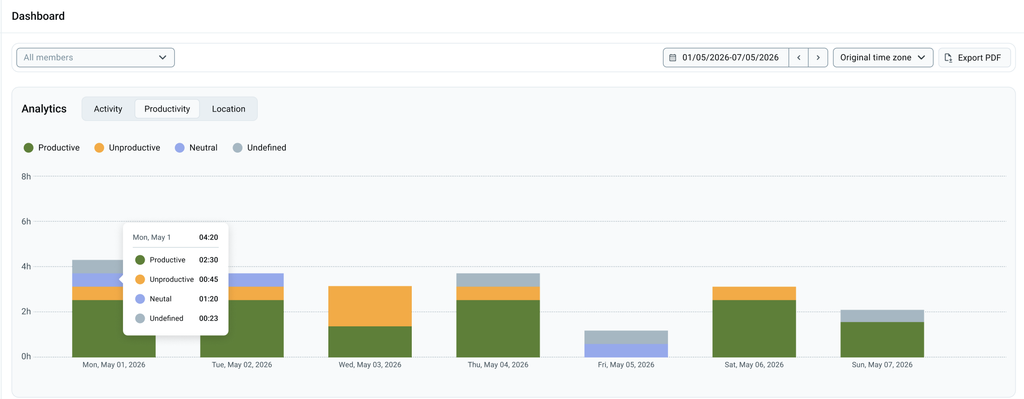
The top section features a bar chart visualizing the overall time tracked over your selected date range.
- Active Time: Represented by the solid dark blue bars.
- Idle Time: Represented by the diagonally striped light blue blocks sitting on top of the active time.
- Tooltips: By hovering your cursor over any specific day’s bar (e.g., “Mon, May 1”), a tooltip will appear showing the exact hours and minutes spent active versus idle, along with the total time recorded for that day.
2. Member Activity #
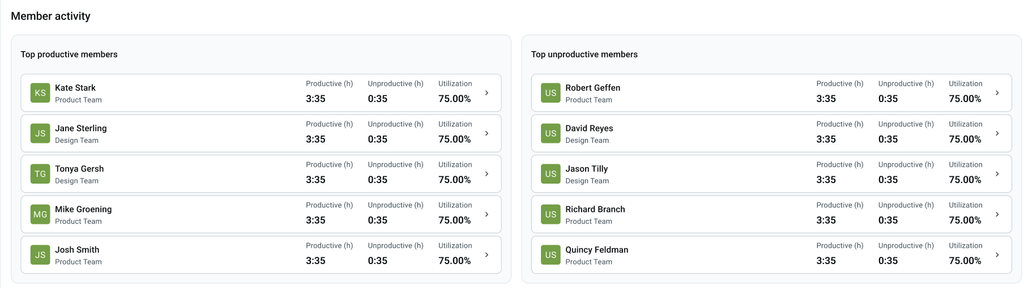
This section breaks down productivity on an individual level, helping you see who is highly utilized and who might need more support. It is split into two panels:
- Top productive members: Lists users with the highest utilization percentages
- Top unproductive members: Lists users with the lowest utilization percentages
- Metrics Shown: For each user, you will see their avatar, name, assigned team (e.g., Product Team, Design Team), total Productive hours, total Unproductive hours, and their overall Utilization percentage. Click View all in the top right corner of either panel to see the full list of team members.
3. Group Activity #
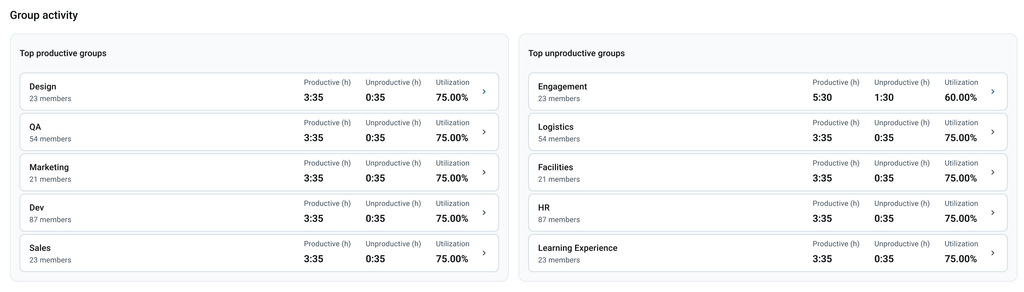
Similar to the Member Activity section, the Group Activity area aggregates data by department or team (e.g., Design, QA, Marketing, Dev, Sales).
- Top productive groups & Top unproductive groups: These side-by-side lists help you evaluate which departments are operating most efficiently.
- Metrics Shown: You will see the group name, the number of members in that group, and the collective Productive hours, Unproductive hours, and Utilization percentage.
4. Apps & Websites Productivity #
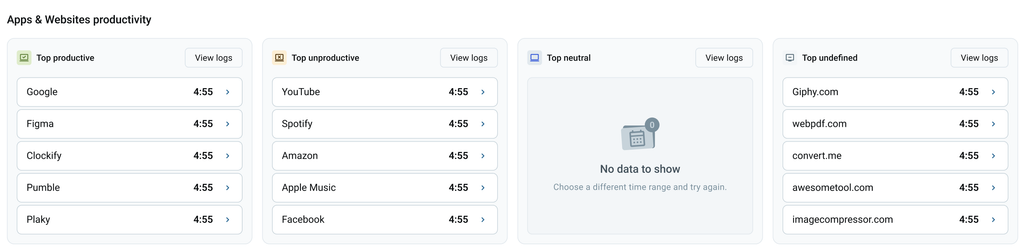
This lower section provides granular insight into exactly Veja como time is being spent by categorizing the specific tools your team uses.
- Top productive apps & websites: Shows the applications (e.g., YouTube) designated as productive for work tasks, alongside the total time spent using them.
- Top unproductive apps & websites: Highlights time spent on tools or sites flagged as non-work-related.
- Top neutral apps & websites: Displays time spent on applications that are neither strictly productive nor unproductive (if data is available for the selected period).
- Top undefined apps & websites: Displays time spent on frequently used applications and websites that have not yet been assigned a specific productivity rule.
Perguntas frequentes #
How do I handle tracking for employees who use multiple computers?
You can assign multiple devices to a single workspace member. The system will automatically aggregate the activity data from all of their assigned devices into one unified profile, giving you a complete view of their productivity metrics.
What happens if an employee’s device loses its internet connection?
If a device goes offline, the desktop agent will securely cache the tracked activity data locally. Once the internet connection is restored, the agent will automatically sync the saved data back to your workspace backend.
How long are captured screenshots stored in the system?
To help manage storage and protect privacy, all screenshots are retained on the server for exactly 60 days. After this period, they are automatically and permanently deleted from the system without requiring any manual action.
Is there a faster way to categorize multiple subdomains for the same website?
Yes, you can use a Domain Wildcard Rule to speed up classification. By adding an asterisk and a dot before a domain (for example, *.google.com), you can categorize all related subdomains in a single step, saving you from having to categorize them one by one.
How does the system decide which productivity rule applies to an employee?
The system evaluates rules in a specific order from most specific to least specific. Individual member rules will always override group and workspace rules. Group rules will override the default workspace settings. Workspace rules act as a global backup for the entire organization.
What happens if an employee belongs to two groups with conflicting app rules?
Conflicts can occur when a person belongs to multiple teams that classify the same website differently. The system resolves this by always choosing the most lenient category.
For example, if one group marks a site as unproductive and another marks it as productive, the system treats it as productive.