Publicado: 30 de enero de 2026
 ¿Cómo utilizas tu fuerza laboral?
Si experimentas problemas con altos costes de la nómina pero bajos ingresos facturables, es probable que estés perdiendo mucho tiempo en tareas internas no facturables.
A continuación veamos cómo generar e interpretar los informes y horarios de Clockify para estimar la utilización de tus empleados y mejorar los resultados.

Maneras de seguir la utilización en Clockify by CAKE.com
Los trabajadores remotos no pueden ver físicamente quién está ocupado (o no) en su equipo. Clockify by CAKE.com proporciona diferentes perspectivas sobre cómo el trabajo se distribuye en tu equipo, calculando:
- Utilización de la capacidad de cada empleado individual,
- Utilización del equipo,
- Utilización del tiempo para individuos y grupos,
- Tiempo dedicado a proyectos específicos,
- Tiempo dedicado a clientes específicos, y
- Coste vs. ingresos para un período de tiempo establecido.
Con estas perspectivas, puedes estimar si necesitas cortar el tiempo que dedicas a tareas no facturables o distribuir el trabajo de manera más justa.
NOTA: No existe una función llamada Tarifa de utilización de Clockify que te puede ayudar con esto. En cambio, Clockify ofrece una manera más elegante de visualizar la utilización en varios niveles. Puedes accederla a través de la función de los informes y horarios de Clockify.
Vamos a explorarlo.

Cómo estimar la utilización de los empleados en Clockify
Para estimar la utilización de los empleados en Clockify y maximizar la facturabilidad, primero necesitas registrar las horas facturables y no facturables.
Cuando tienes datos correctos, puedes estimar la utilización individual y de equipo comparando las horas de tareas o proyectos facturables/no facturables.
A continuación te explicamos los 3 pasos simples para hacerlo.
🎓 Las 28 mejores prácticas y consejos de control del tiempo
Paso 1: Configura los proyectos correctamente
Para configurar tus proyectos de Clockify de manera correcta para poder calcular la utilización, necesitas asegurar que:
- Los proyectos incluyan los usuarios que registrarán el tiempo en ellos,
- Los proyectos estén correctamente configurados como facturables/no facturables,
- Los proyectos incluyan las tareas que son correctamente configuradas como facturables/no facturables (si utilizas tareas para tus proyectos).
Para encontrar más información sobre cómo configurar y utilizar proyectos, consulta el siguiente vídeo.
Paso 2: Asegúrate de que el tiempo se registre correctamente
Para asegúrate de que el tiempo se registre correctamente, debes:
- Revisar y aprobar las entradas de tiempo de tu equipo,
- Verificar dos veces si las tarifas de los miembros y la tarifa de la jerarquía están configuradas correctamente (Ve a Espacio de trabajo > Proyecto > Miembro > Tarea),
- Verificar si la cantidad y los costes en tareas y proyectos específicos son correctas.
La precisión de la estimación de tu utilización depende directamente de la precisión de los datos.
El siguiente vídeo tutorial te puede ayudar a configurar las tarifas para tener resultados correctos.
Paso 3: Analiza los resultados
Para un resumen rápido de en lo qué tu equipo está trabajando más, consulta tu panel de Clockify.
Para tener una información aún más específica, navega a Informes y elige el tipo de informe: Resumido, Detallado, o Semanal.
- Informe detallado te permite ver todo el tiempo registrado en tu espacio de trabajo en detalles, hacer auditorías de tiempo y editar el tiempo para otros.
- Informe semanal te permite ver el tiempo de tu equipo y proyecto por semana.
- Informe resumido desglosa los datos por equipo, proyecto, fecha, facturablidad y más.
Ahora repasamos los informes de Clockify para ver qué información proporcionan.
Estima la utilización del equipo con los informes resumidos de Clockify
Clockify by CAKE.com calcula las horas, los costes y los importes con precisión para tu trabajo según las entradas de tiempo de tus usuarios.
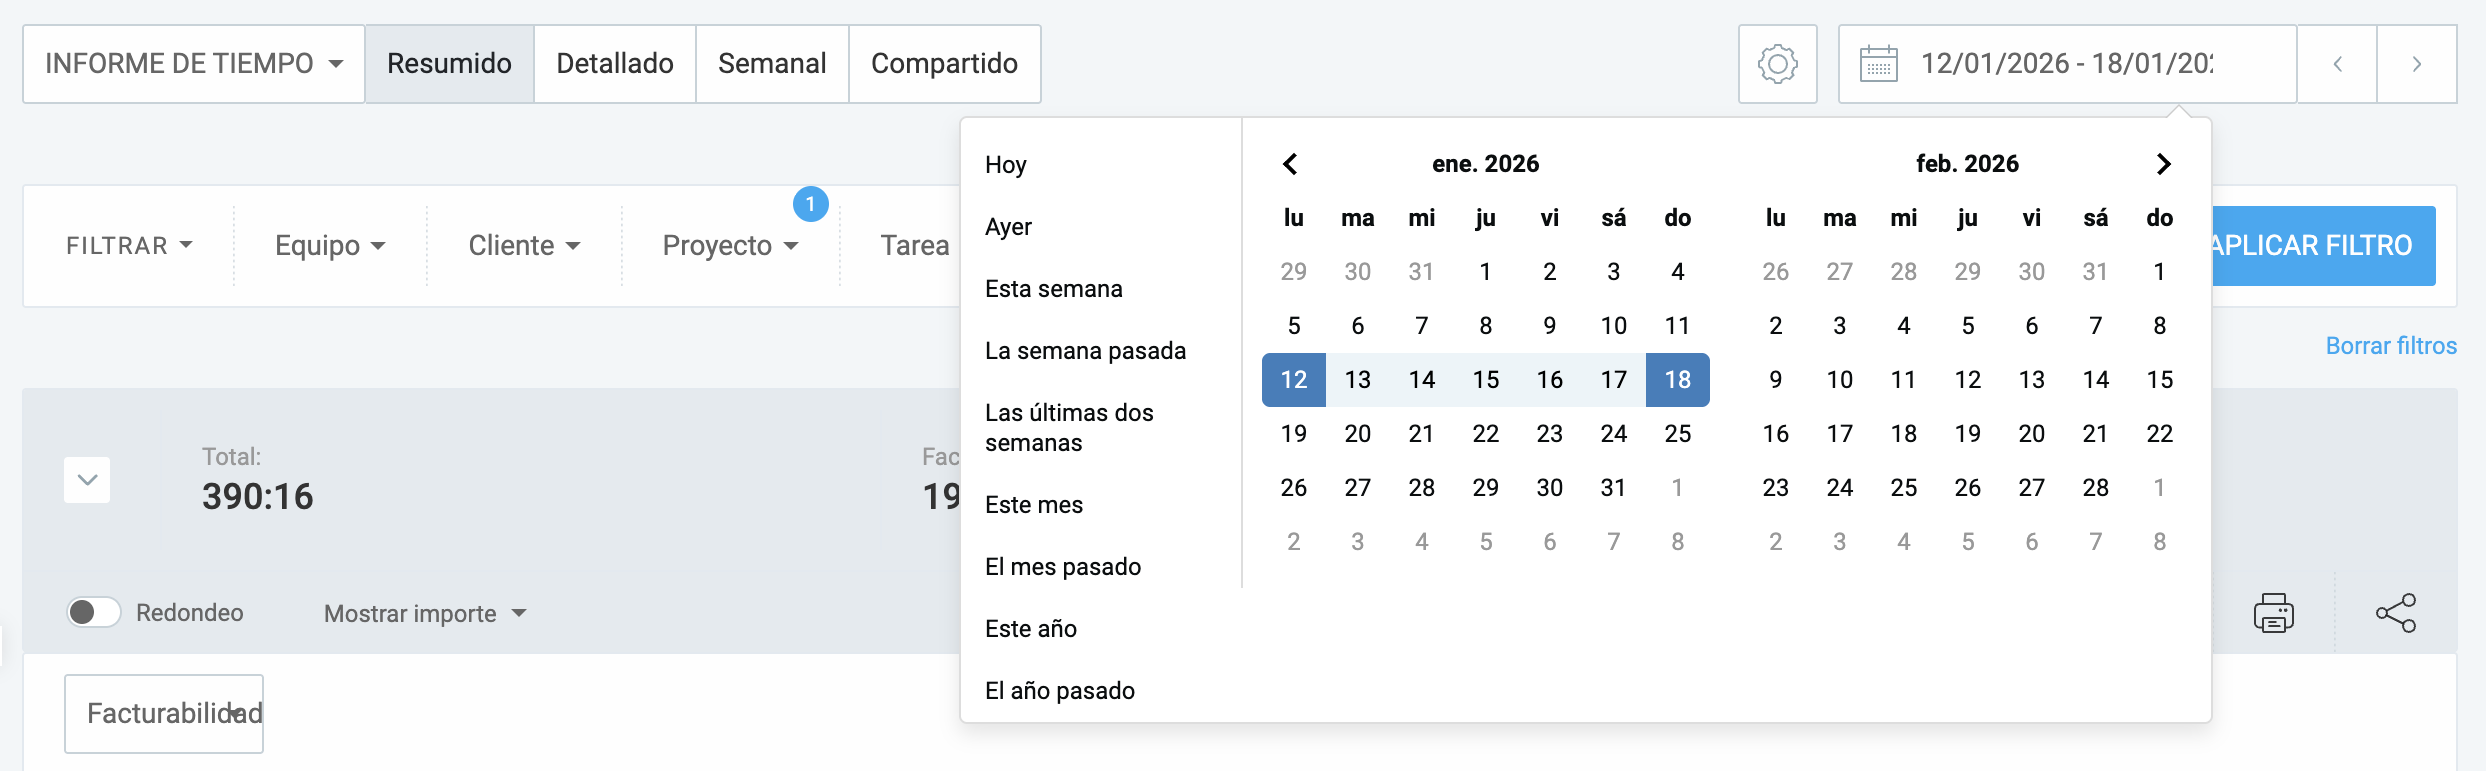
Encuentra Informes en el menú del lado izquierdo, luego ve a Informe de tiempo, y selecciona Resumido. Esta vista es la manera más fácil de comparar tus horas registradas. Selecciona el período de tiempo en la parte derecha y experimenta con los filtros para encontrar los datos que necesitas.
En los siguientes ejemplos, verás diferentes enfoques en la visualización de utilización con la función de informes de Clockify.
A continuación veamos qué pueden revelar los datos.
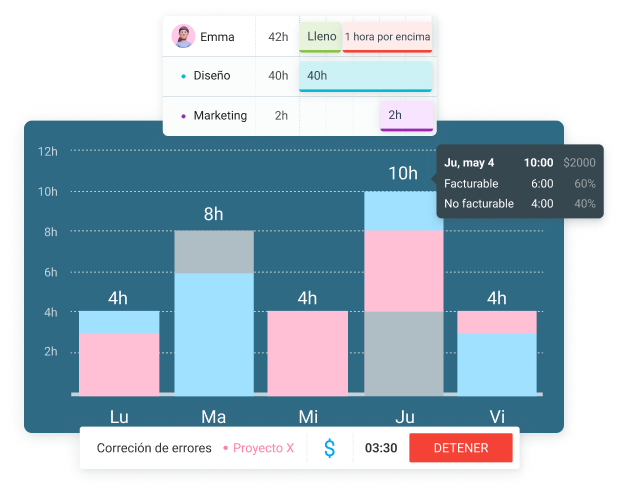
Ejemplo 1: Compara las horas facturables y no facturables
Como gerente remoto, puedes comparar las horas facturables habilitando la opción Mostrar importe en la pestaña gris bajo el período de tiempo. Esto permite que las horas facturables se presenten junto a las horas registradas para el período seleccionado.
De esta vista, puedes ver las horas completas trabajadas durante el período de tiempo que eliges vs. las horas registradas facturables.
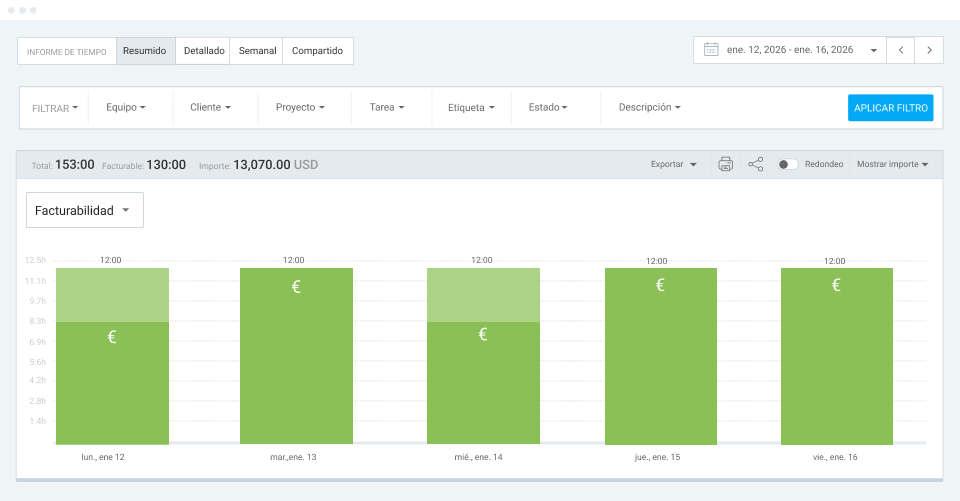
En este ejemplo, configuro los filtros para mostrar cómo varios miembros se desempeñaron durante un período de una semana en un proyecto específico. Después de hacer clic en Aplicar filtro, el resultado se ve así:
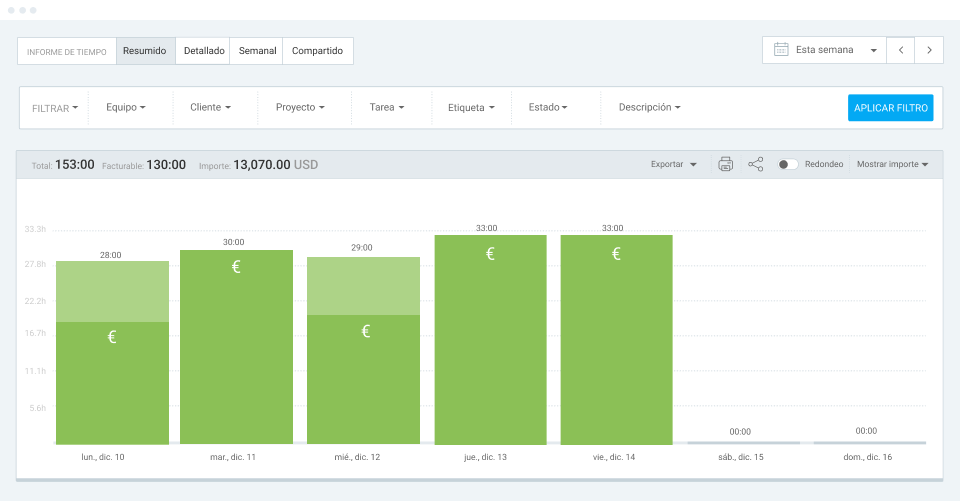
Aquí, puedo ver que mi equipo ha registrado 153 horas, de las que 133 fueron facturables. Esto me da una prueba visual de la capacidad para poder prevenir el agotamiento antes de que cause una rotación del personal, lo que es especialmente útil para los gerentes de la entrega.
NOTA: Para calcular la tarifa de la utilización de los recursos estándar según la capacidad total disponible de una persona, necesitas usar un informe diferente en Clockify. Volvemos a esto más adelante en la sección Calcular la utilización de recursos con Clockify.
Ejemplo 2: Compara los usuarios
Manteniendo los filtros de los ejemplos anteriores, analizo el período de una semana.
Sin embargo, al habilitar las opciones Mostrar coste y Mostrar beneficio al lado del importe, puedes tener una perspectiva adicional. Ahora Clockify muestra si un usuario dedicó demasiado tiempo en tareas no facturables o que se haya agotado.
Aquí es un ejemplo que incluye 1 proyecto, 1 semana y 4 miembros.
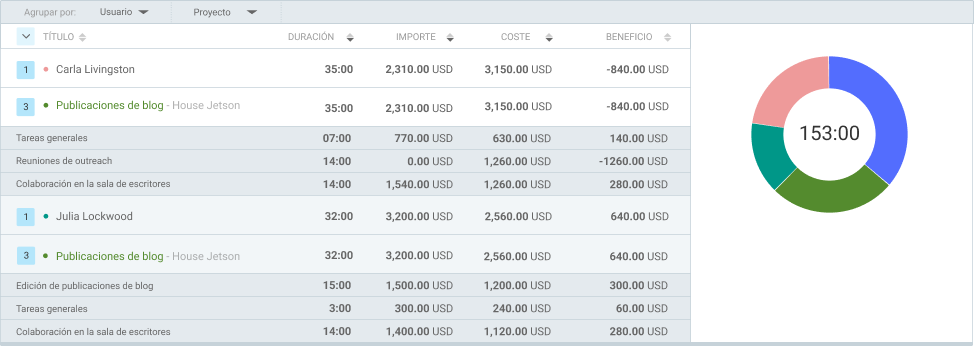
Aquí puedo ver que Carla ha registrado 35 horas esta semana y de estas ha dedicado 14 horas a reuniones de outreach (una tarea dentro del proyecto “Publicaciones de blog”).
Ya que estas reuniones no son facturables, se ha producido un saldo semanal negativo. El trabajo de Carla cuesta más de lo que ha ganado esta semana. Sería mejor cambiar las cosas un poco para que menos tiempo se dedique a este tipo de actividades en el futuro.
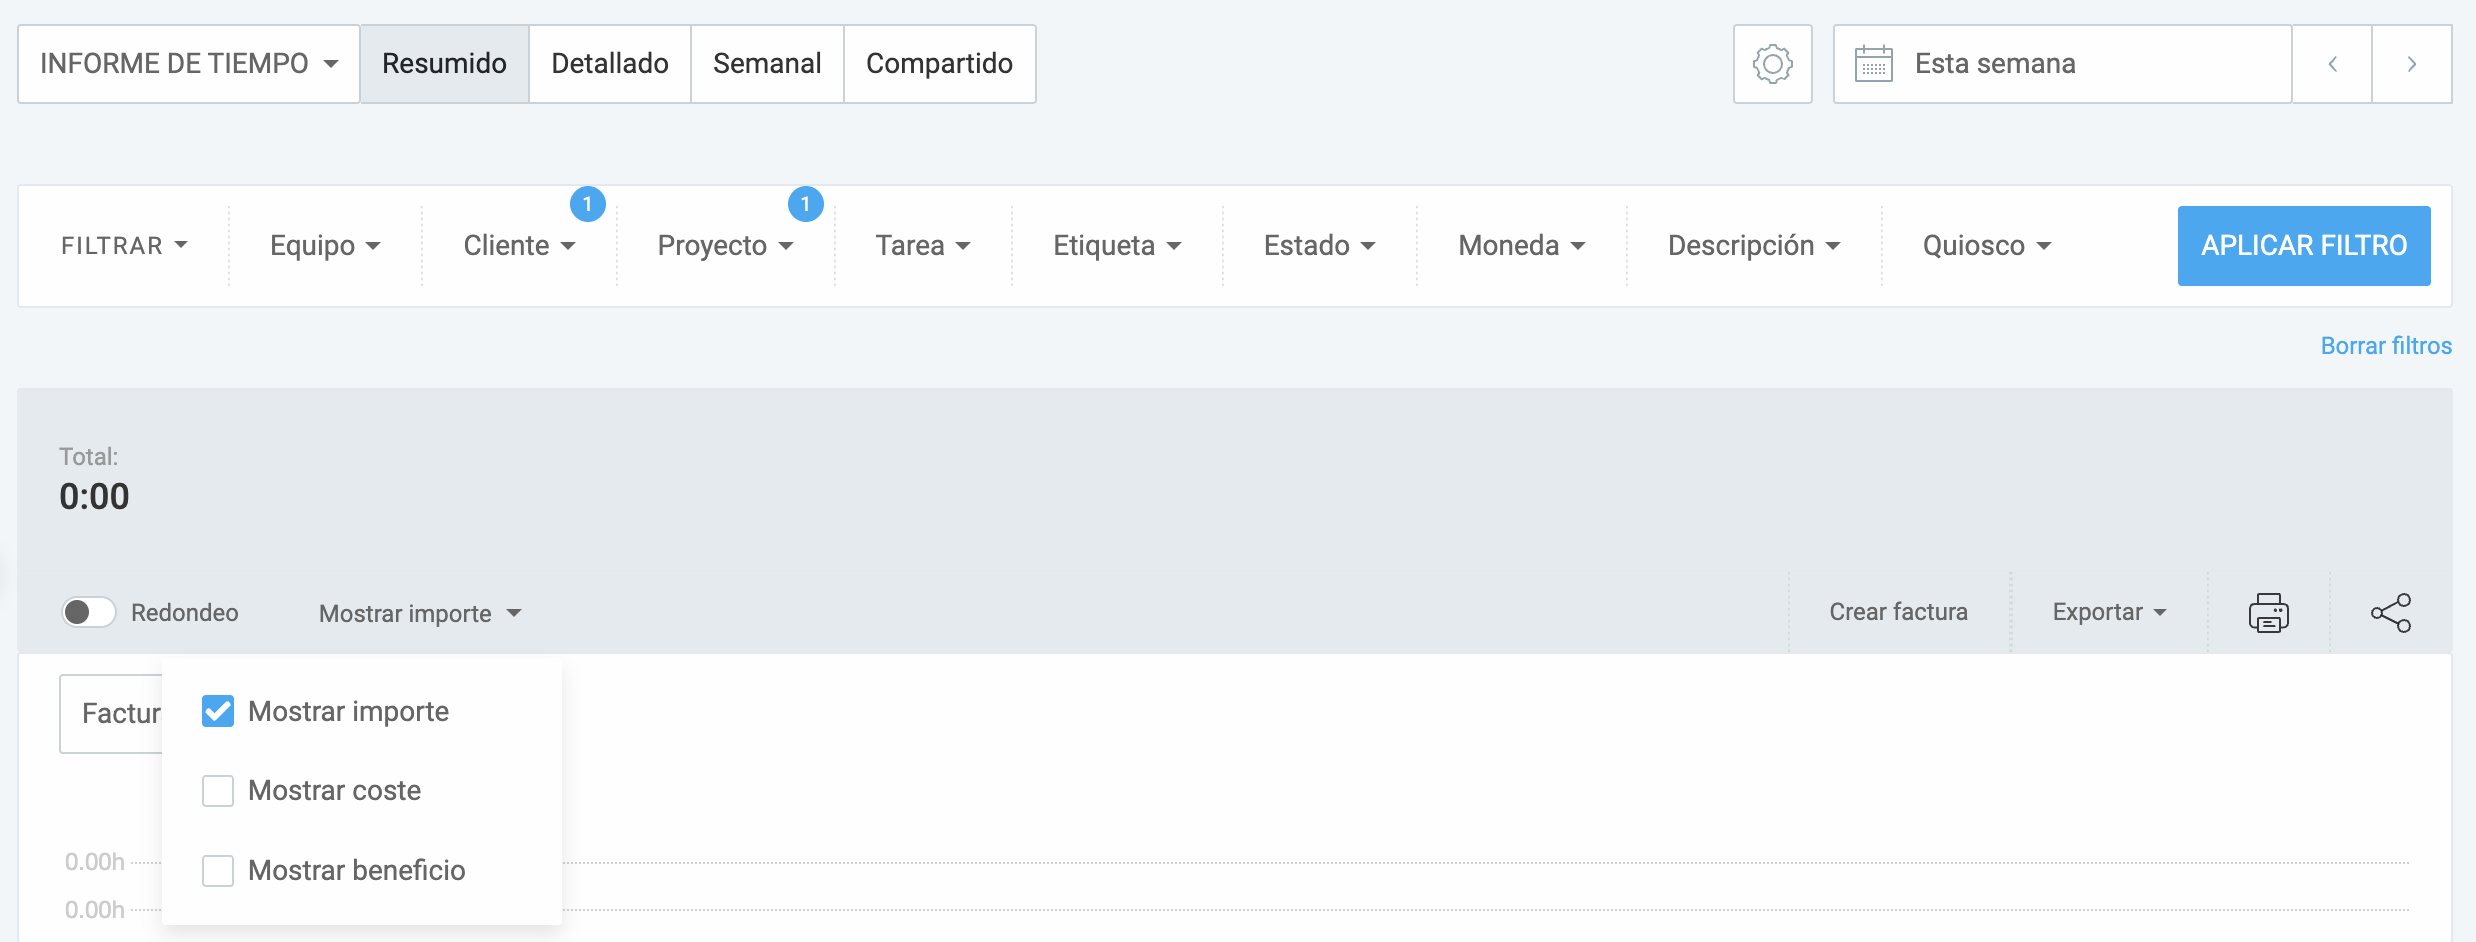
Si solo quieres ver el tiempo y excluir los ingresos, desmarca Importe, Coste, y Beneficio bajo el período de tiempo. Naturalmente, esta vista te mostrará solo el tiempo dedicado a las tareas específicas, no el beneficio asociado con las horas de trabajo.
🎓 Cómo calcular las horas facturables (+ Plantilla gratuita de horas facturables)
NOTA: Siempre puedes hablar a nuestro equipo de soporte amigable completamente humano, disponible 24/7, gratuitamente para los usuarios de todos los planes. Te ayudan a calcular tu tarifa de utilización en Clockify by CAKE.com con precisión.
Ejemplo 3: Compara el tiempo y los beneficios para un período específico
Desde ahí, puedes experimentar con filtros para obtener diferentes perspectivas. Puedes cambiar la vista de los datos seleccionando filtros adecuados en la sección Agrupar por..
Por ejemplo, puedes ver cuánto tiempo trabajó, te costó y te ganó un grupo seleccionado de personas en dos semanas diferentes. Solamente agrupa tus datos por semanas. El resultado debería presentarse algo así:
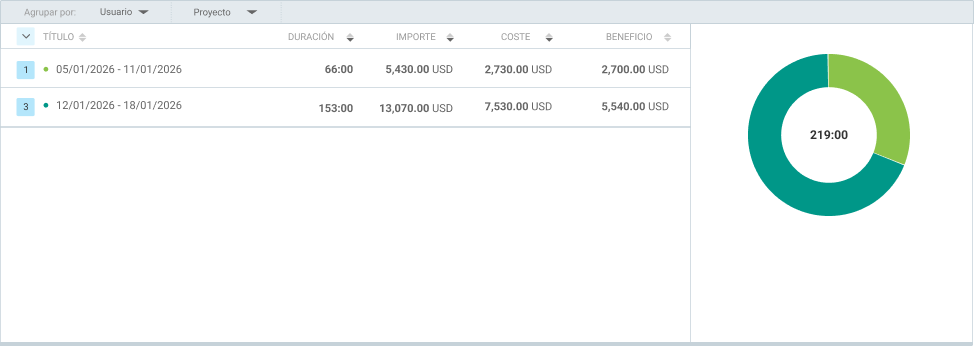
Puedes comparar proyectos, usuarios o grupos y sus contribuciones en términos de horas trabajadas y costes financieros.
Además, puedes analizar cuánto tiempo se dedica a clientes específicos, a descansos (si has habilitado su registro en la configuración de tu espacio de trabajo), y mucho más.
Para una vista aún más detallada de tipos de informes específicos, como informes de asistencia o asignación, consulta el siguiente vídeo.
Utiliza las cronogramas de proyecto de Clockify para organizar mejor el trabajo
Como gerente, la información que se obtiene de los informes puede inspirarte a tomar un enfoque diferente en el futuro. Por ejemplo, si decides que necesitas acortar el tiempo dedicado a un tipo de tarea, puedes planificar en consecuencia. Es entonces que la planificación de Clockify resulta útil.
Una vez que configuras un proyecto y sus tareas, puedes planificarlos en avance:
- Ve a Plan, luego Proyecto,
- Crea un nuevo proyecto o elige uno existente, y
- Añade miembros haciendo clic en la flecha al lado del nombre del proyecto que añades.
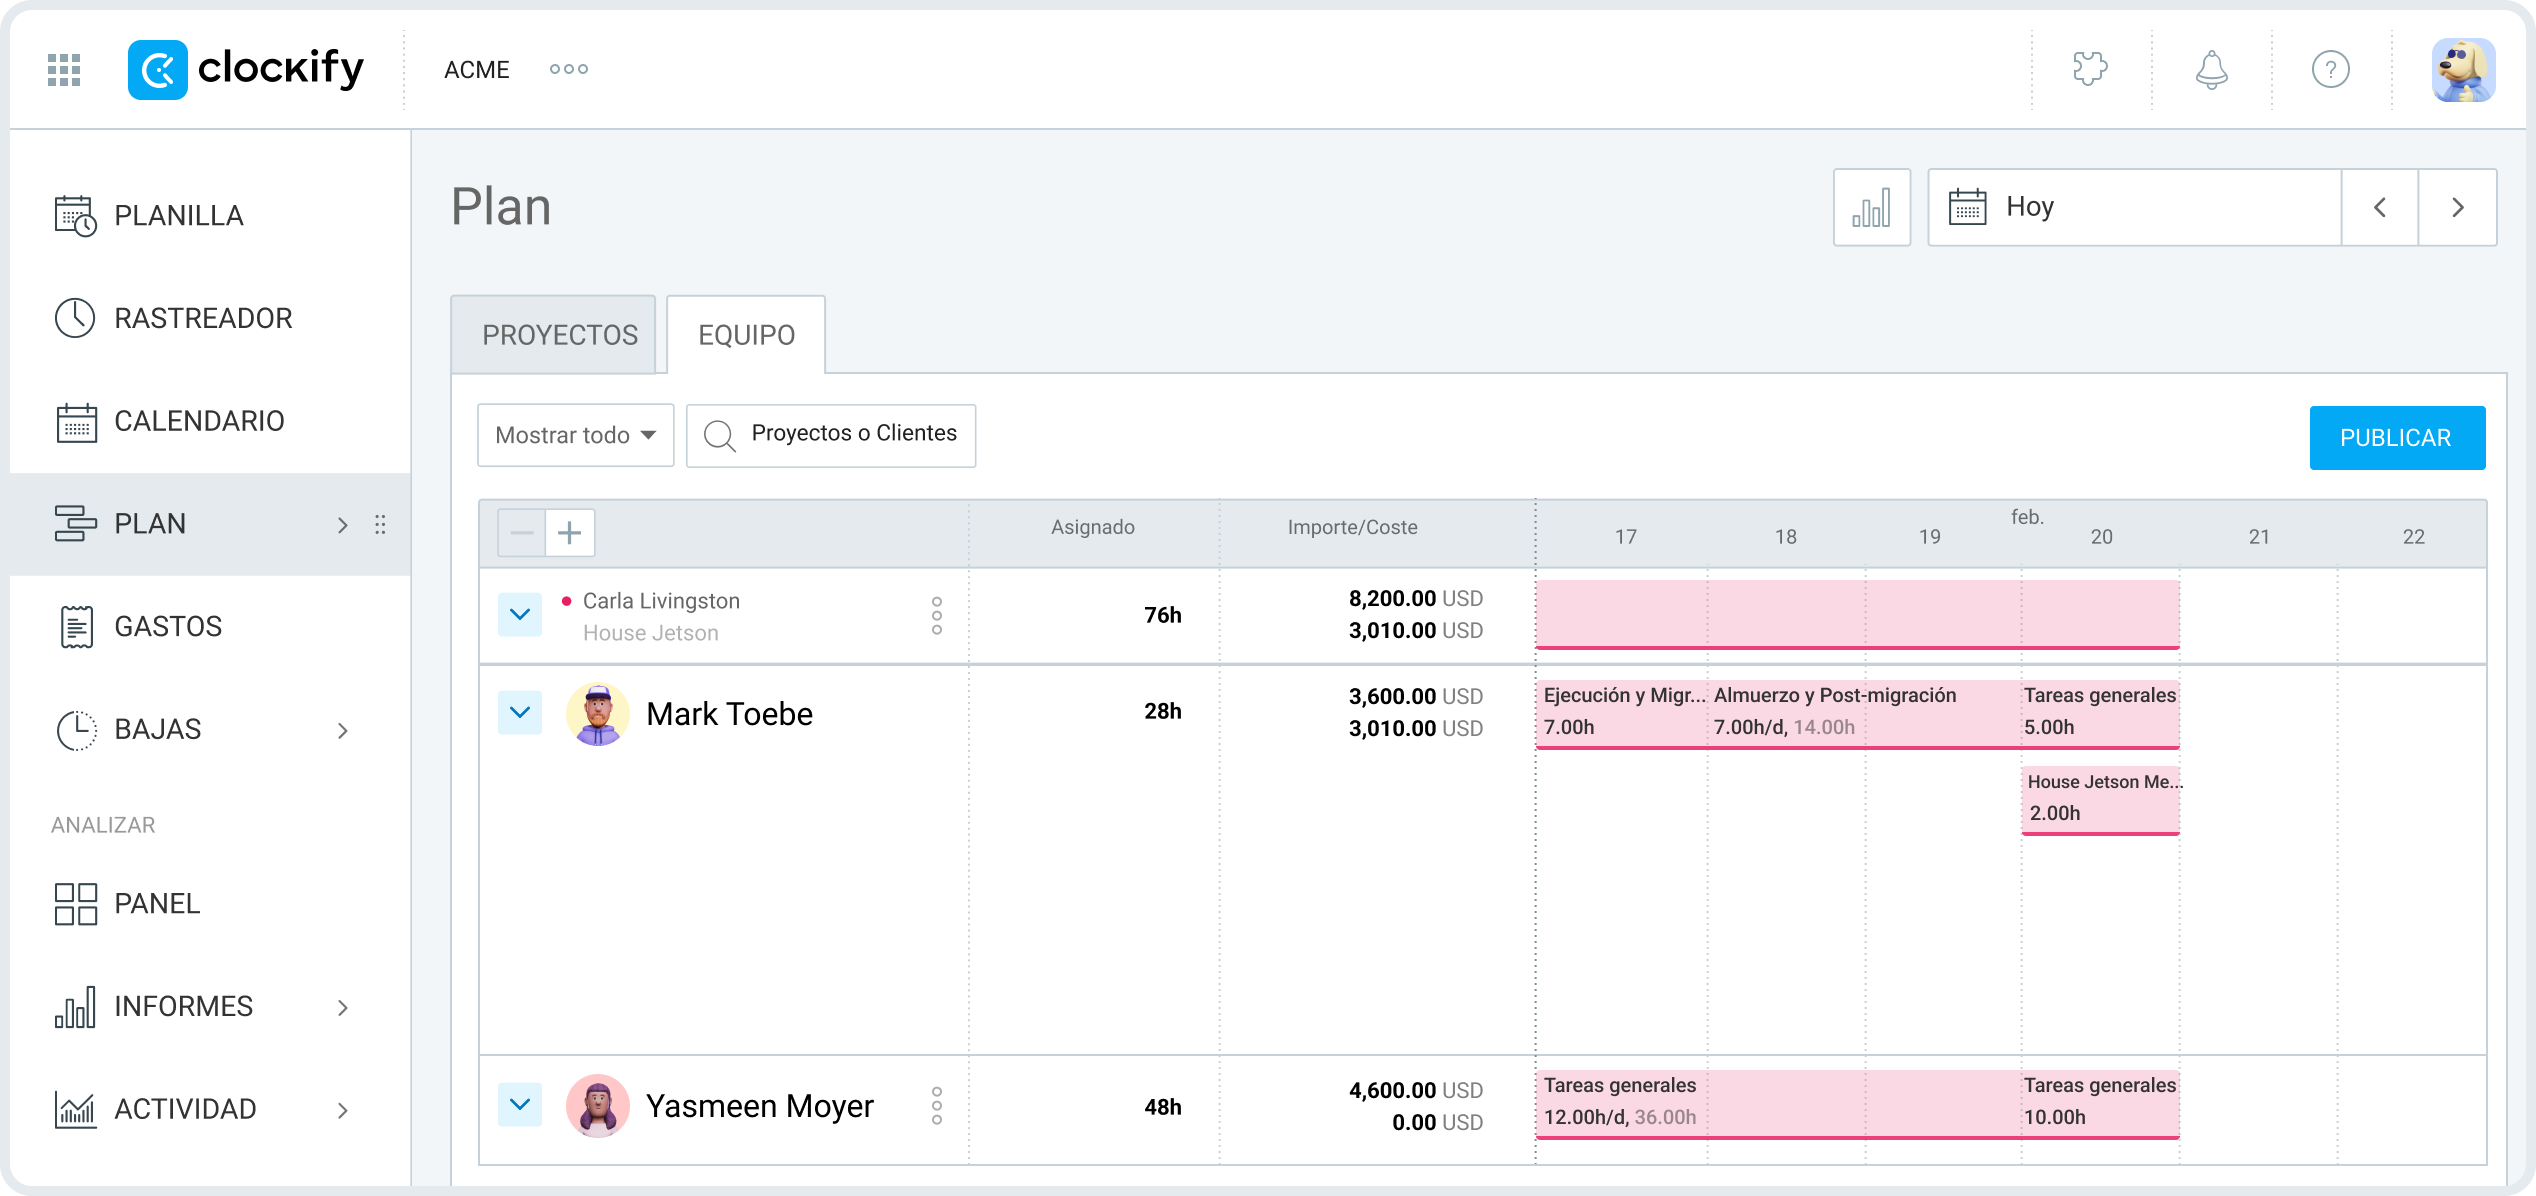
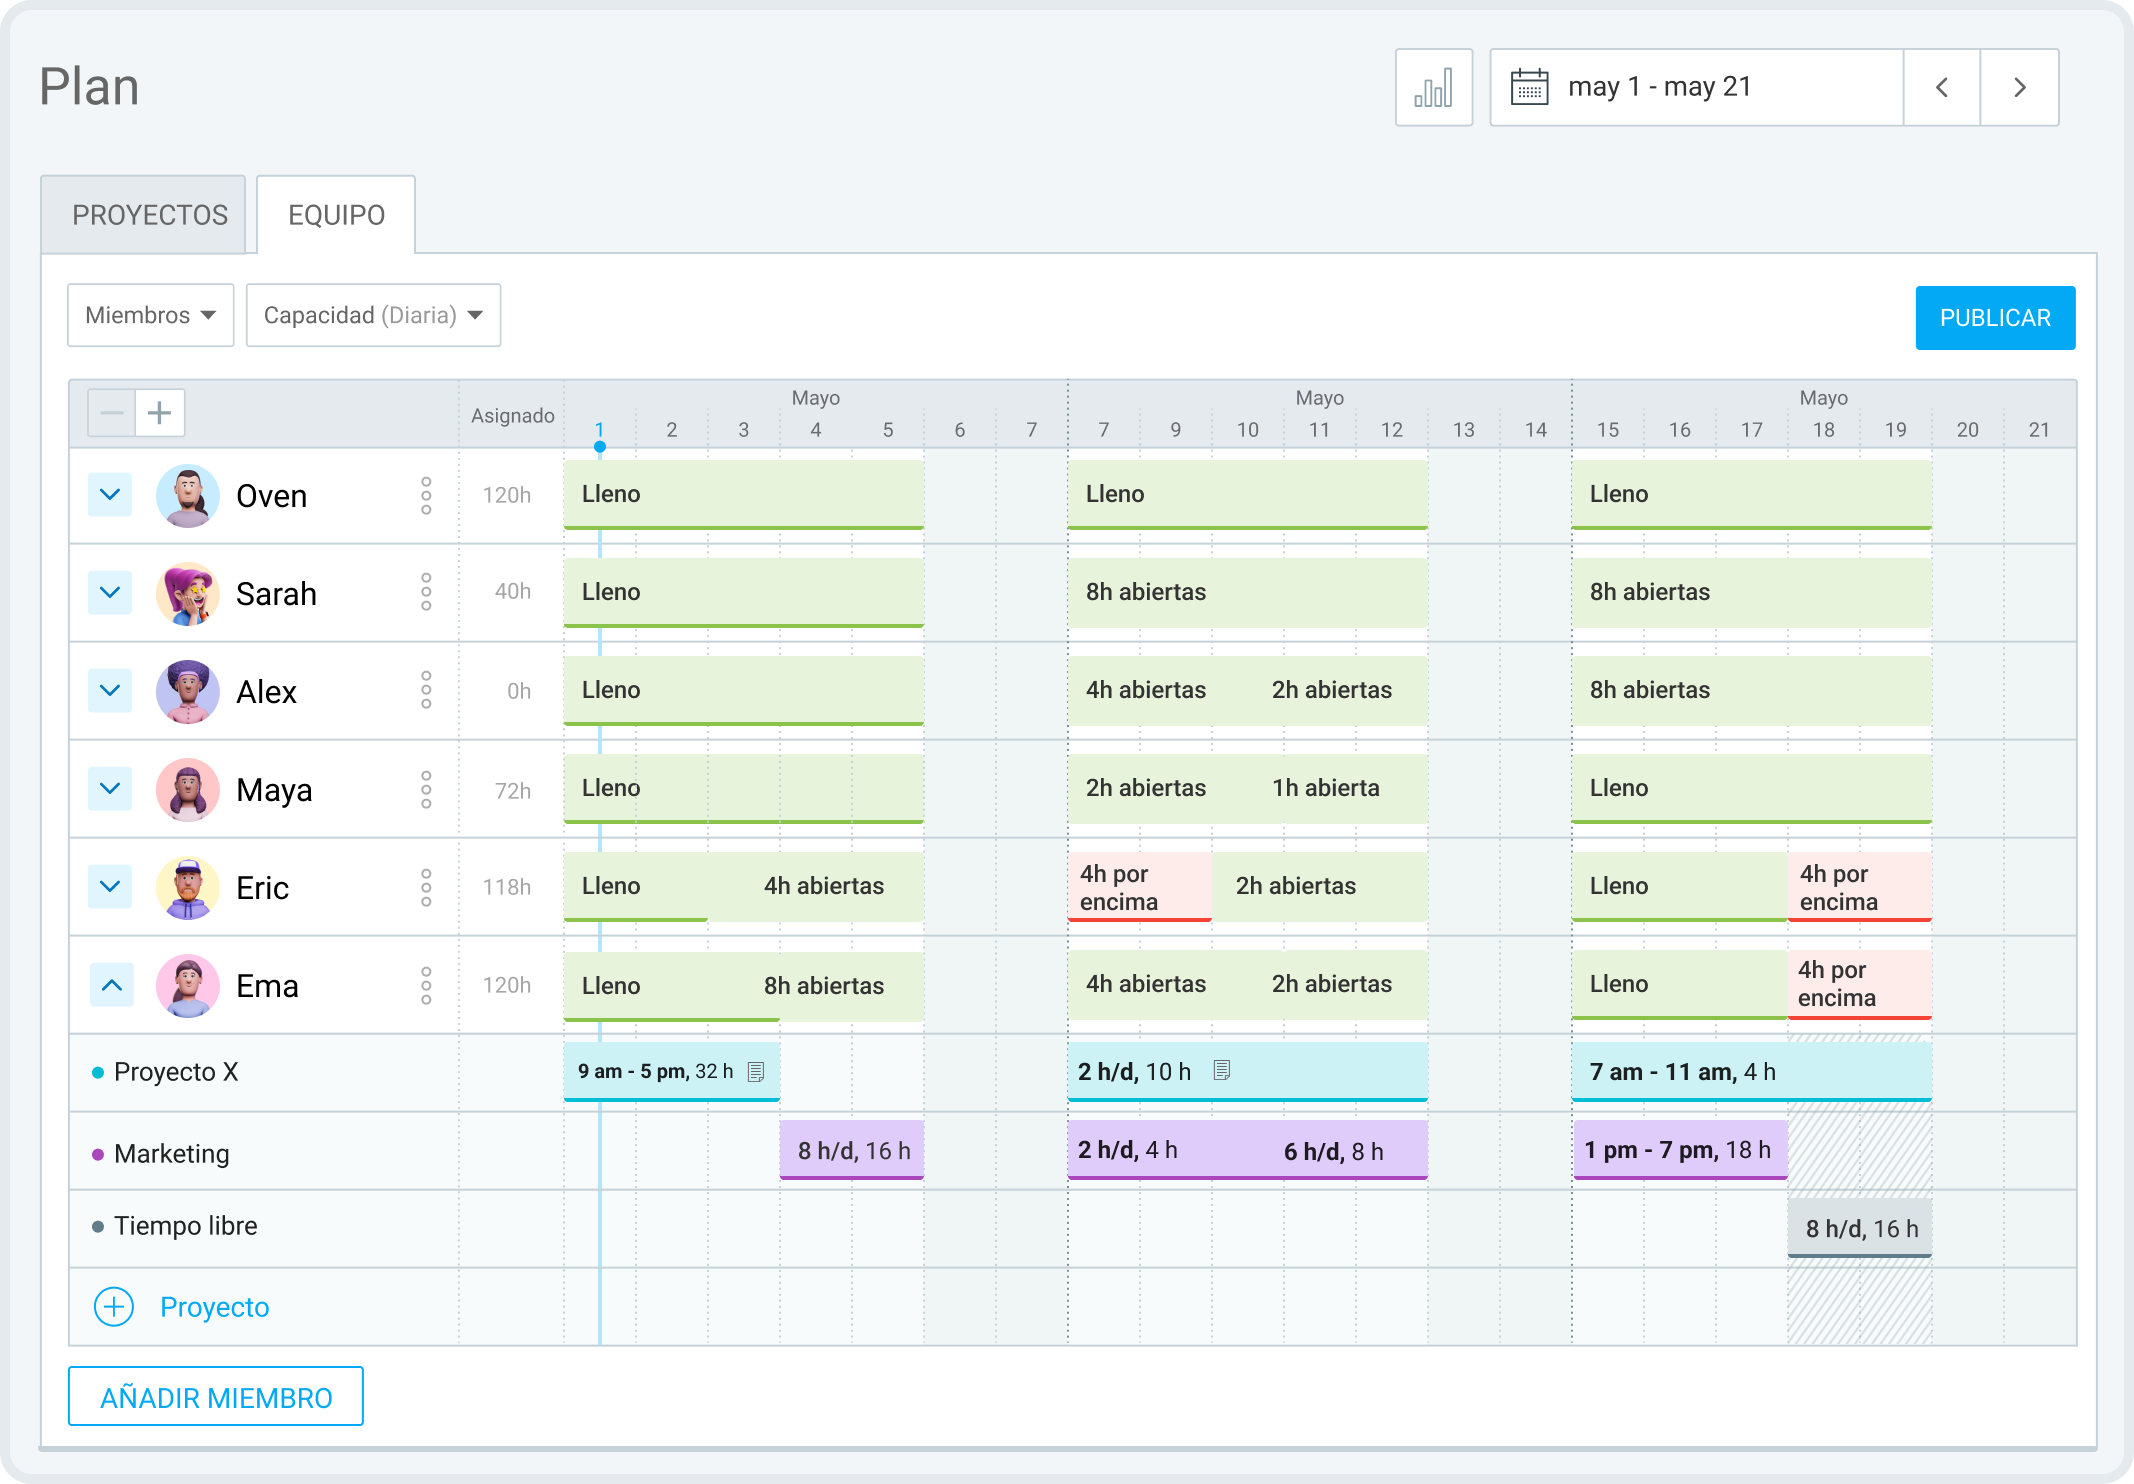
La vista de plan mantiene las tarifas que estableces y la facturabilidad de cada tarea en el proyecto. Al añadir el proyecto y los usuarios, puedes seleccionar el período de tiempo. Verás una línea temporal donde puedes añadir tareas conectadas al proyecto y establecer horas esperadas para cada día. El resultado se verá algo así:
Los horarios sirven mejor como punto de referencia para la planificación de capacidad de empleados. Sin embargo, los proyectos dinámicos a menudo parecen diferentes en la práctica.
Puedes planificar una capacidad mínima y volver a tu plan más tarde si algunas tareas se vuelven urgentes. Solamente asegúrate de hacer clic en el botón Publicar, esto notificará a los miembros de tu equipo de tus expectativas.
Luego, la vista puede ser útil para personalizar tu enfoque. Al comparar tus horarios con el tiempo que tus empleados realmente registraron, puedes crear mejores planes para el futuro.
Esta opción es extremadamente útil para planificación de recursos y para simplificar el registro de tiempo de tu equipo. Una vez publicado, todos en tu equipo verán sus horas planificadas en la vista del calendario.
Desde allí, podrás copiarlas como entradas de tiempo y establecer las horas de inicio y fin o iniciar su temporizador, dependiendo de tu configuración de control de tiempo.
Una vez que estableces tu horario, hay más de una manera de adaptarlo en tiempo real. Ahora lo exploramos.
Prueba la planificación en Clockify GRATIS
NOTA: Siempre puedes hablar a nuestro equipo de soporte amigable completamente humano, disponible 24/7, gratuitamente para los usuarios de todos los planes. Te ayudan a calcular tu tarifa de utilización en Clockify con precisión.
Utiliza el horario del equipo de Clockify para ver la disponibilidad del equipo
Otra función útil de la planificación de Clockify es la reasignación de recursos en vivo. Si surge una tarea o una reunión urgente, es posible que necesites incluirla en tu horario futuro.
Para ver los trabajadores con horas de trabajo disponibles:
- Navega a Horario, luego Equipo,
- Selecciona el período de tiempo que necesitas, y
- Selecciona los usuarios elegibles para la tarea seleccionada.
Clockify by CAKE.com automáticamente compara las horas que planificas vs. las horas disponibles en la capacidad diaria de trabajo de los miembros de tu equipo. Desde allí, verás una línea de tiempo con sus horas disponibles para cada día. Esto es ideal para prevenir el agotamiento porque verás quién superó su capacidad de trabajo.
Puedes añadir horas haciendo clic en el usuario, seleccionando el espacio blanco de abajo, eligiendo el proyecto y la tarea y haciendo clic en Publicar. Al hacer clic en un espacio vacío en un día específico se abre una caja de Crear asignación.
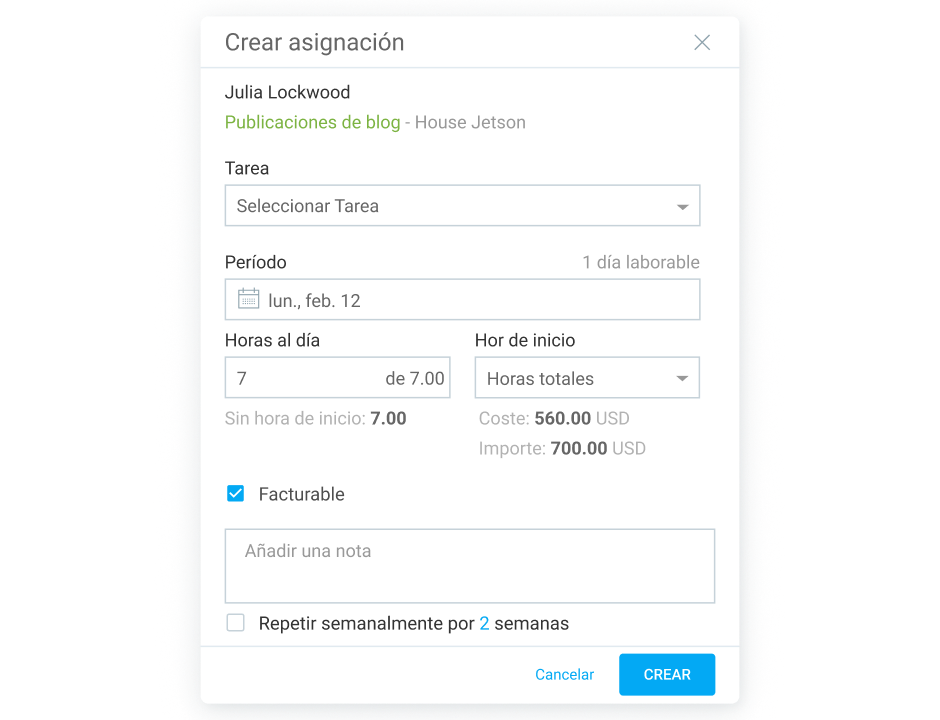
Si alguien solicita tiempo libre y se aprueba, Clockify marcará su tiempo planificado en rojo, notificando sobre el cambio de la planificación.
Para investigar la planificación de tareas en Clockify aún más, consulta nuestro tutorial de planificación a continuación.
Calcula la utilización de recursos con Clockify by CAKE.com
Si necesitas más información sobre la utilización de recursos, puedes usar los informes de asignaciones de Clockify.
El formulario estándar de la utilización de recursos es:
Horas de trabajo total / Capacidad (Horas disponibles) x 100
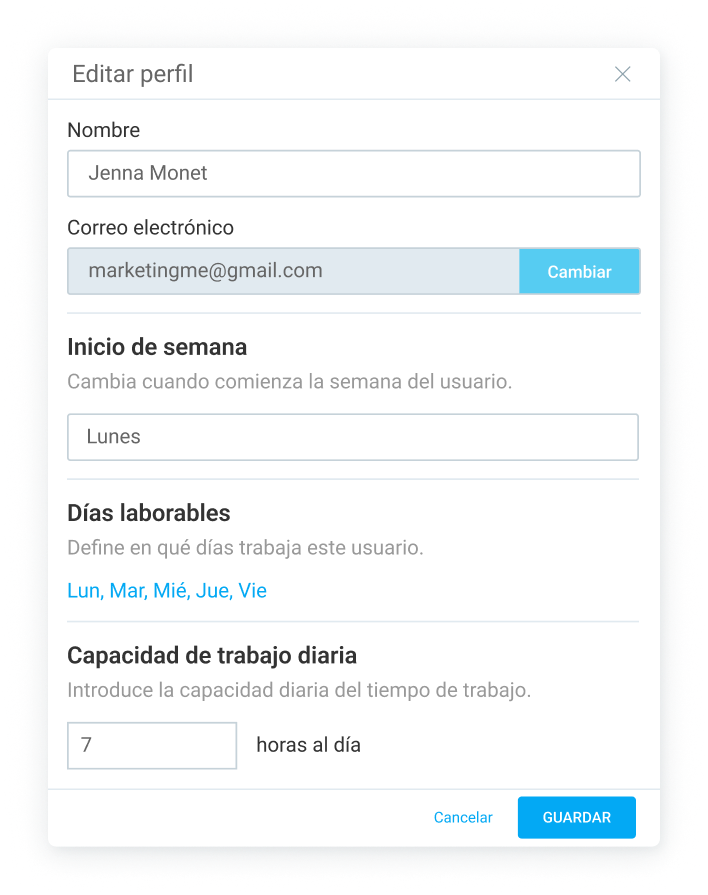
La capacidad de un trabajador se puede establecer bajo Equipo > Usuario > Editar perfil, luego desplazándose hasta la opción Capacidad de trabajo diaria, presentada en horas.
Para comparar la capacidad de una persona con su tiempo disponible, necesitarás un proyecto planificado para un período específico.
Después, ve a Informes, luego Asignaciones. Selecciona el período de tiempo y cualquier Filtros que necesitas. Agrupa la información según usuario en la pestaña gris, y según tarea (opcional). Debería verse algo así:
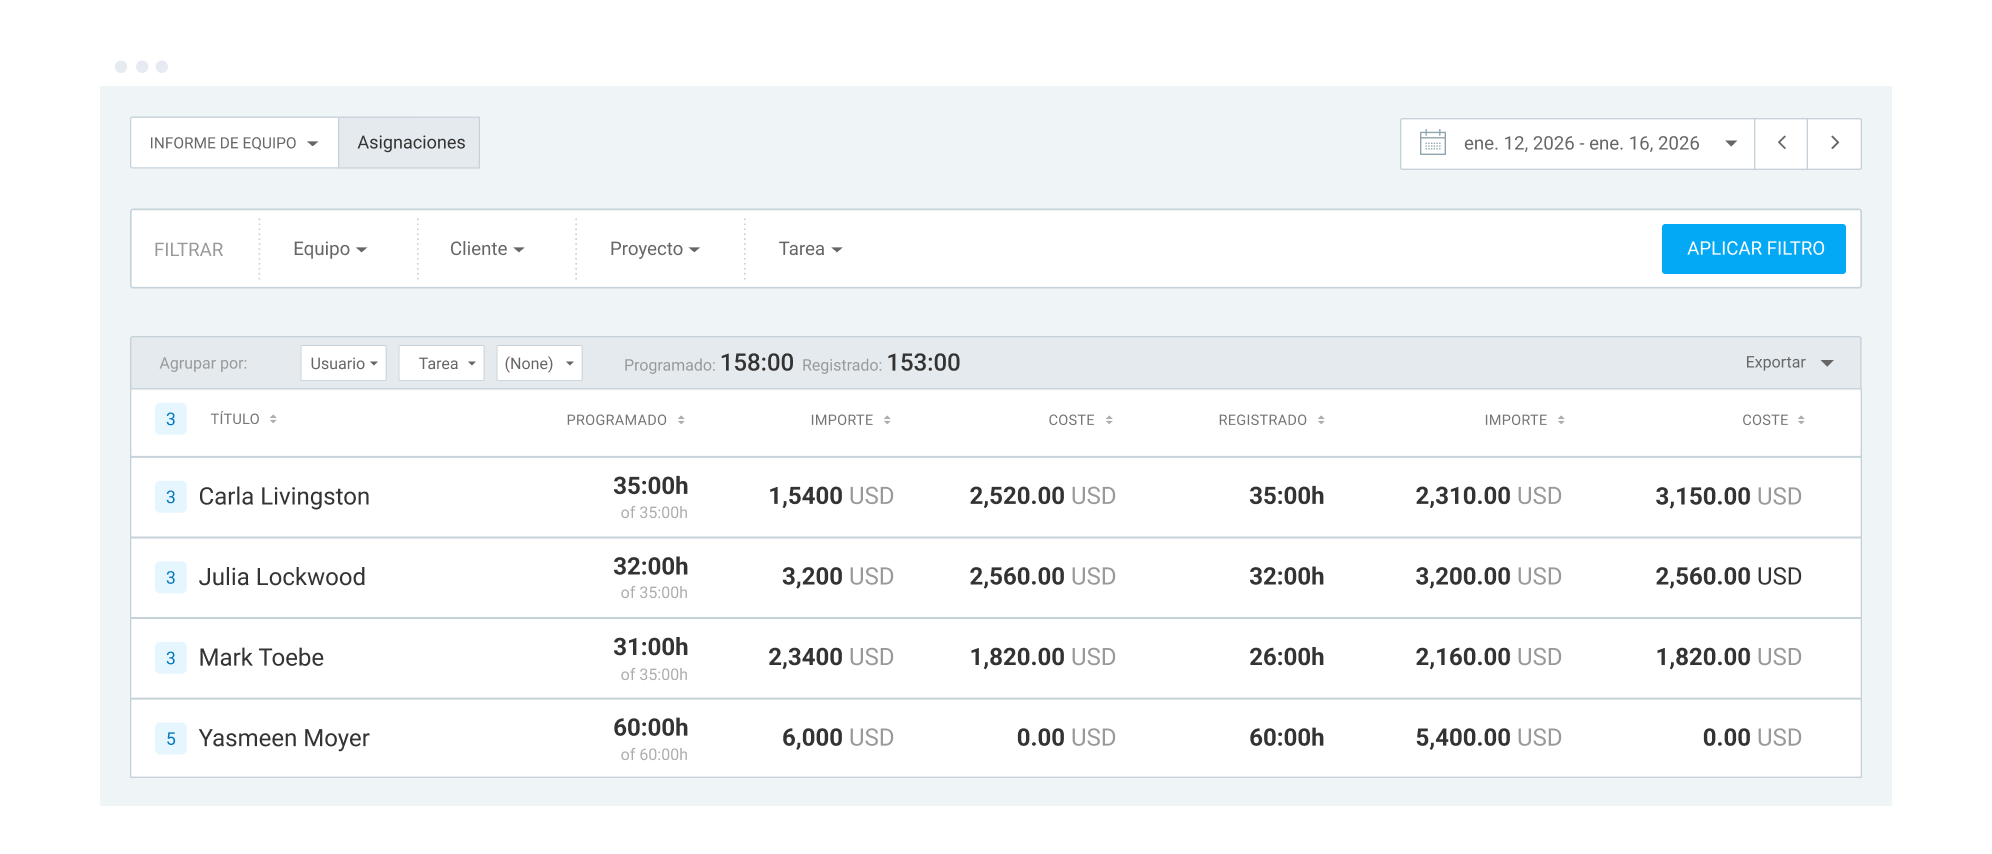
En la columna Programado verás las horas planificadas vs. la capacidad total de la persona para el período de tiempo que has seleccionado. Divide los dos números de la columna y multiplícalos con 100 para calcular la tarifa de utilización de recursos para el período de tiempo.
Por ejemplo, la utilización de recursos para el usuario Mark Toebe del imágen anterior se calculará así: 31 (horas totales que Mark trabajó, de la columna Planificado) dividido por 35 (sus horas totales disponibles, de la misma columna) multiplicado con 100. Esto nos da la tarifa de utilización de recursos de 88,57%.
La única limitación aquí es que tienes que planificar las horas en avance para calcular la tarifa exacta con precisión.
Sin embargo, puedes también comparar la columna Registrado y el valor “de: X horas” en la columna Planificado. De esa manera, puedes ver cuántas horas un usuario ha registrado en comparación a sus horas totales disponibles.
Este informe es también útil para encontrar cuánto deberían haberte costado tus horas planificadas y el importe que pretendías ganar. Puedes compararlo con las horas reales registradas para ver los beneficios que has hecho (Importe) vs. cuánto te costó (Coste). La información se basa en lo que los usuarios han registrado.
Al final, este importe calcula la diferencia entre tu idea inicial y el trabajo realmente realizado, en términos de horas, el importe ganado y el coste.

Preguntas frecuentes sobre informes de Clockify
Let’s take a look at the most commonly asked questions about utilizing reports in Clockify by CAKE.com.
¿Cómo obtener un informe de Clockify?
Puedes generar un informe en Clockify si has aprobado las entradas de tiempo de los usuarios de tu espacio de trabajo. Navega a Informes, selecciona el período de tiempo y los filtros para generar el informe que necesitas.
¿Cómo exportar un informe en Clockify?
Para exportar un informe en Clockify:
- Navega a los Informes y seleciona Resumido, Detallado, o Semanal,
- Elige el período de tiempo,
- Aplica los filtros para generar el informe exacto que necesitas,
- Haz clic en Exportar en la pestaña gris, y
- Guárdalo como PDF, CSV o Excel.
Obtén los informes de Clockify
¿Cómo compartir un informe de Clockify?
Para compartir un informe de Clockify, navega a Informes y primero selecciona los filtros correctos. Esto te deja elegir qué información incluir en tu informe. Puedes incluir cualquier información desde las horas trabajadas de tu equipo hasta el coste de tu fuerza laboral o tus ingresos.
Después, puedes compartir el informe exportándolo como un documento o generando un enlace que lleva a él. Controlas quién puede verlo, qué se puede ver y puedes eliminarlo en cualquier momento para anular el acceso.
¿Cómo encontrar tu utilización en Clockify?
Puedes estimar tu utilización realizando un seguimiento preciso de horas facturables y no facturables para el período que quieres analizar.
Para encontrar tu tarifa de utilización en Clockify, ve a Informes > Informes de tiempo > Resumido. Selecciona el período de tiempo que quieres, selecciona el filtro Equipo y busca tu perfil de usuario.
El informe te mostrará cuántas horas has registrado y cuántas has dedicado a tareas facturables y no facturables. Asegúrate solo de seleccionar Mostrar importe en la parte derecha.
Compara los números para ver tu utilización para el período que eliges. Puedes hacerlo para múltiples usuarios, proyectos, tareas o clientes al mismo tiempo. Tu informe debería verse algo así:
¿Cómo encontrar el tiempo de utilización en Clockify?
Puedes encontrar el tiempo de utilización en los informes de Clockify comparando el tiempo registrado con las tareas no facturables y facturables:
- Ve a Informes, luego a Informes de tiempo,
- Selecciona Resumido, luego selecciona el período de tiempo,
- Aplica los filtros para incluir los proyectos, usuarios y tareas que quieres, y
- Asegúrate de habilitar la opción de Mostrar importe en la pestaña gris (bajo el período de tiempo), esto muestra horas facturables por separado.
Opcionalmente, puedes ver los resultados para usuarios individuales o comparar los equipos desplazándote y agrupando las entradas de tiempo según tus necesidades.
NOTA: Siempre puedes hablar a nuestro equipo de soporte amigable completamente humano, disponible 24/7, gratuitamente para los usuarios de todos los planes. Te ayudan a calcular tu tarifa de utilización en Clockify con precisión.
¿Cómo crear un informe de utilización en Clockify?
To create a utilization report in Clockify by CAKE.com, you can analyze the time tracked by your users.
Para crear un informe de utilización:
- Ve a Informes, luego Resumido,
- Selecciona el período de fechas que quieres de la parte derecha,
- En la sección de filtros, selecciona Equipo, luego encuentra los grupos de usuarios o usuarios que quieres analizar.
En la pestaña gris que muestra el total de horas, en la extrema derecha, puedes seleccionar para incluir el coste, los ingresos o el importe. El Importe se debe habilitar para que la información de horas facturables aparezca por separado.
Puedes experimentar con los filtros para crear el informe exacto que quieres, incluyendo los clientes, proyectos, tareas, etiquetas o quioscos específicos de los que los usuarios fichan la entrada.
Al final, selecciona la opción de exportar en la pestaña gris y guárdalo como PDF, CSV o Excel. Alternativamente, puedes generar un enlace para compartirlo con un cliente o socio. Pruébalo antes de enviarlo y asegúrate de no incluir ninguna información confidencial.
Para aprender más sobre la organización de tu trabajo con Clockify, asegúrate de visitar el canal de YouTube de Clockify.
Cómo revisamos esta publicación: Nuestros escritores y editores monitorean las publicaciones y las actualizan cuando hay nueva información disponible, para mantenerlas frescas y relevantes.