Naviguer dans le tableau de bord
Le tableau de bord fournit des informations importantes sur votre utilisation du temps, vous permettant de voir comment votre temps est réparti entre différentes activités, projets et heures facturables.
Vues du tableau de bord #
Le tableau de bord propose deux vues principales, vous permettant d’analyser soit votre productivité personnelle, soit l’activité de votre équipe.
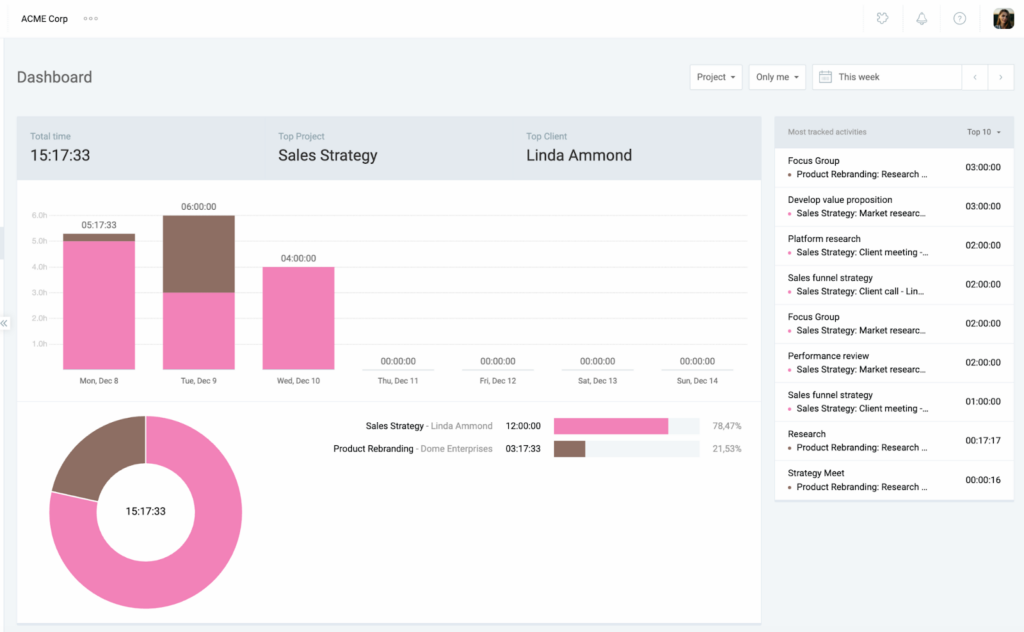
Personnelle (Moi seul) #
Cette vue est axée sur vos performances individuelles. Elle vous permet de :
- Analyser votre utilisation personnelle du temps
- Consulter la répartition entre votre temps facturable et non facturable
- Consulter la répartition détaillée du temps passé sur chaque projet
- Consulter vos activités les plus suivies afin de reprendre rapidement le travail
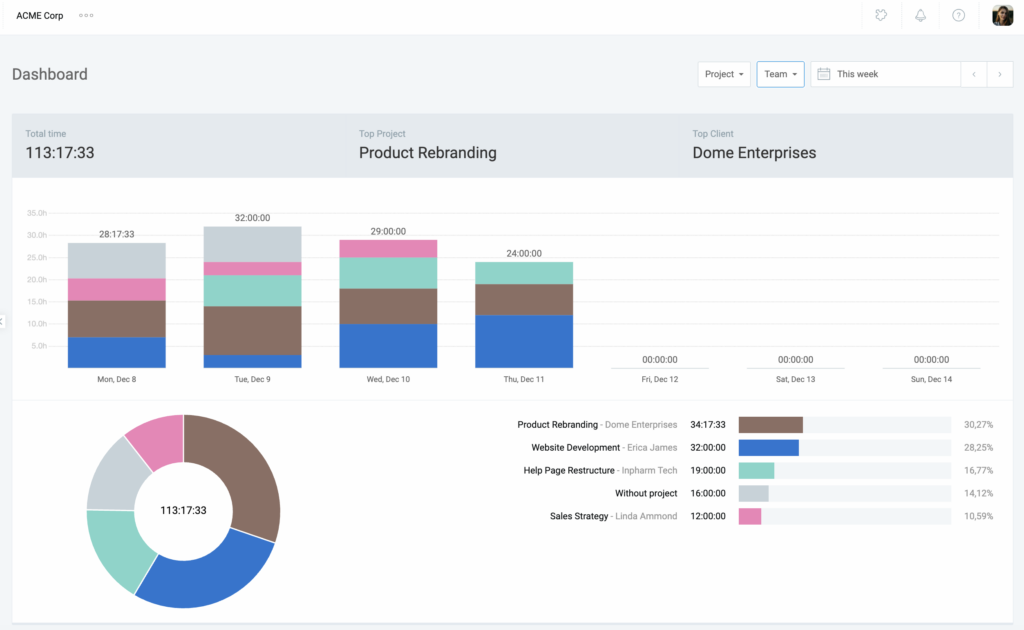
Équipe #
Cette vue est destinée aux responsables et aux administrateurs. Elle offre un aperçu complet du temps suivi par votre équipe, notamment :
- Le temps total suivi pour tous les membres de l’équipe
- Ce sur quoi chaque membre de l’équipe travaille actuellement ou sa dernière activité enregistrée
- Une ventilation détaillée du temps passé par l’équipe par projet ou par facturation
Changer la vue du tableau de bord #
Vous pouvez facilement passer de votre tableau de bord personnel (Moi seul) au tableau de bord de l’équipe à l’aide du bouton situé dans le coin supérieur droit de la page.
1. Accédez à la page Tableau de bord
2. Sélectionnez Moi seul ou Équipe dans le menu déroulant situé dans le coin supérieur droit de la page
Données et indicateurs #
Les données affichées s’adaptent selon que vous consultez le tableau de bord personnel ou celui de l’équipe.
Vue personelle #
Voici une ventilation des données et des indicateurs affichés dans le tableau de bord personnel :
| Indicateur | Ce que cela montre |
| Facturabilité | Voyez quelle part de votre temps suivi est facturable et quelle part ne l’est pas |
| Projets | Obtenez une ventilation du temps que vous avez consacré à chaque projet |
| Activités les plus suivies | Consultez les activités que vous suivez le plus fréquemment et voyez le temps total que vous y avez consacré |
Vue de l’équipe #
Le tableau de bord de l’équipe affiche les indicateurs suivants :
| Indicateur | Ce que cela montre |
| Temps total | Le temps total suivi pour tous les membres de l’équipe pendant une période sélectionnée |
| Activités de l’équipe | Un tableau affichant l’activité la plus récente de chaque membre de l’équipe. Il indique qui est actuellement actif (minuteur en cours) ou leur dernière saisie enregistrée |
| Tableau des projets/facturation | Une ventilation visuelle du temps suivi par l’équipe par projet ou par statut de facturation |
Filtres par vue #
Le tableau suivant présente les options de filtrage disponibles dans le tableau de bord et leurs différences entre les vues Personnelle et Équipe :
| Fonctionnalité | Ce que cela fait | Vue personelle | Vue de l’équipe |
| Période | Sélectionnez une plage de dates personnalisée pour afficher vos saisies de temps pour une période spécifique | Oui | Oui |
| Projet | Choisissez d’afficher le temps que vous avez suivi pour des projets spécifiques | Oui | Oui |
| Facturation | Consultez la répartition du temps entre les activités facturables et non facturables | Oui | Oui |
| Afficher les activités | Choisissez d’afficher tout ce que vous avez fait ou seulement vos 10 tâches principales | Oui | Non applicable |
| Trier la liste | Modifiez l’ordre par membre de l’équipe, par date ou par durée totale | Non applicable | Oui |
Afficher le minuteur de l’équipe #
Pour voir qui travaille sur quelle tâche à un moment donné, vous pouvez :
- Aller à la page Tableau de bord
- Filtrer l’affichage sur Équipe
- Faire défiler vers le bas jusqu’à Activités de l’équipe
Les minuteurs en cours sont indiqués par un point rouge à côté du temps de course du membre de l’équipe.
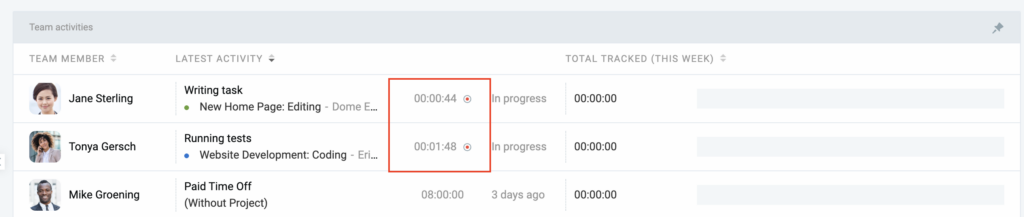
Vous pouvez trier ce tableau par Dernière activité afin que les utilisateurs actifs apparaissent en haut de la liste.
Épingler l’activité de l’équipe #
Pour vous assurer que le tableau des activités de l’équipe reste toujours visible en haut de la page, cliquez sur l’icône Épingler en haut dans le coin supérieur droit du tableau.
1. Accédez à la page Tableau de bord
2. Filtrez l’affichage sur Équipe
3. Cliquez sur l’icône en forme d’épingle dans le coin supérieur droit du tableau Activités de l’équipe