Navigate your dashboard
The Dashboard page provides insights into your time usage, showing how your time is spent across activities, projects, and billable hours.
Dashboard views #
The Dashboard offers two primary views, allowing you to analyze either your personal productivity or your team’s activity.
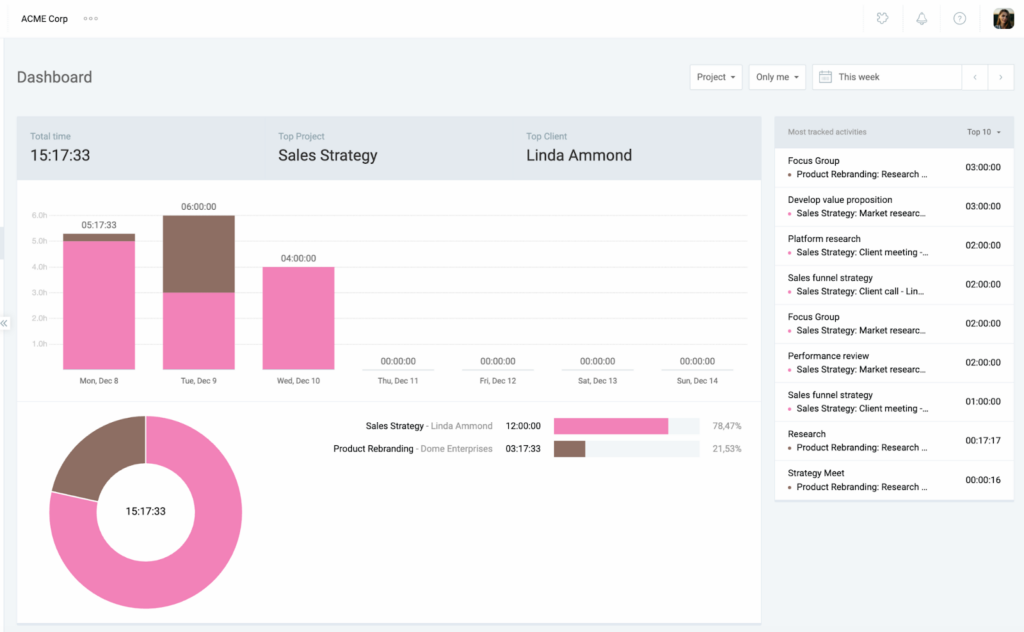
Personal (Only me) #
This view is focused on your individual performance. It allows you to:
- Analyze your personal time usage
- View your billable vs. non-billable time breakdown
- See a detailed breakdown of time spent on each project
- View your most tracked activities to quickly resume work
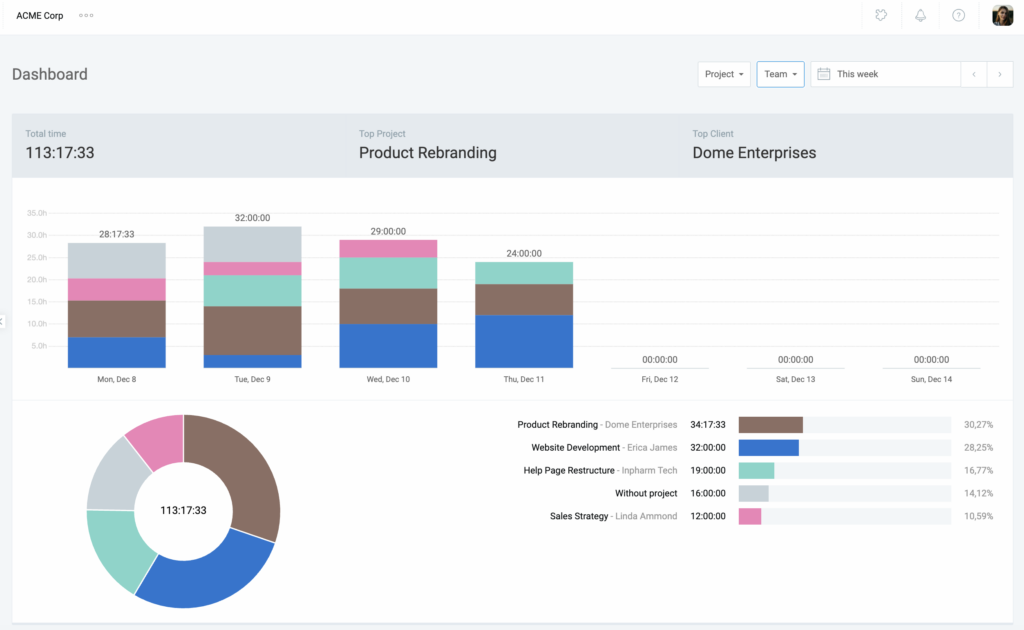
Team #
This view is designed for managers and administrators. It provides a comprehensive overview of your team’s tracked time, including:
- The Total tracked time for all team members.
- What each team member is currently working on or their most recent logged activity.
- A granular breakdown of team time by project or billability.
Switch dashboard view #
You can easily switch between your personal dashboard (Only me) and the team dashboard using the toggle in the upper-right corner of the page.
1. Go to the Dashboard page
2. Select Only me or Team from the dropdown on the top right corner of the page
Data and metrics #
The data displayed adjusts based on whether you are viewing the Personal or Team dashboard.
Personal view #
Here’s a breakdown of the data and metrics shown in the personal dashboard:
| Metric | What it shows |
| Billability | A chart showing the percentage breakdown of your tracked time as billable vs. non-billable. |
| Projects | A breakdown showing how much time you have spent on each project. |
| Most tracked activities | Your top 10 most frequently logged activities and the total time spent on each. |
Team view #
The team dashboard shows the following metrics:
| Metric | What it shows |
| Total time | The total tracked time for all team members in the selected time period. |
| Team activities table | A table displaying each team member’s most recent activity. This shows who is currently active (timer running) or their last logged entry. |
| Project/billability chart | A visual breakdown of the team’s tracked time by project or billability status. |
Filters by view #
The following table outlines the filtering options available in the Dashboard and how they differ between the Personal and Team views:
| Feature | What it does | Personal view | Team view |
| Date range | Choose a specific day, week, or custom period to see your data. | Yes | Yes |
| Project | See time spent on specific projects (yours or the whole team’s). | Yes | Yes |
| Billability | Switch between seeing paid (billable) and unpaid work. | Yes | Yes |
| Show activities | Choose to see everything you did or just your Top 10 tasks. | Yes | N/A |
| Sort list | Change the order by team member, most recent, or total time. | N/A | Yes |
View team’s running timer #
To see who’s working on what task at the moment, you can:
- Go to the Dashboard page
- Filter the view to Team
- Scroll down to Team activities
Running timers are indicated by a red dot next to the team member’s running time.
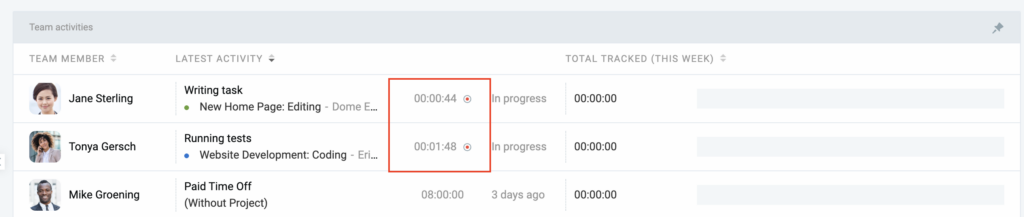
You can sort this table by Latest activity so active users appear on top of the list.
Pin team activity #
To ensure the Team activities table is always visible at the top of the page, click the Pin to top icon in the upper right corner of the table.
1. Go to the Dashboard page
2. Filter the view to Team
3. Click the pin icon on the top-right corner of the Team activities table