In general terms, Key Performance Indicators (KPIs) are the crucial indicators of the progress you are making towards a strategic objective.
In this article, you’ll learn everything there is to know to help you grasp the concept of Key Performance Indicators and inspire you to consider how best to define them in your own organization. For that reason, we’ll answer some of the most frequently asked questions regarding KPIs:
- What is a Key Performance Indicator,
- Types of KPIs,
- What are the benefits of KPIs,
- How do you set KPIs,
- What are some KPI examples across industries,
- How to create a KPI in Excel, and much more.

- Key Performance Indicators give insights into your goals’ progress.
- There are different types of KPIs, depending on the different levels of organization and how they help contribute to an organization.
- To be able to set KPIs you must follow certain steps, including defining business objectives, linking the objectives to your KPIs, defining success criteria for your KPIs, defining how you will measure success, and finally writing your KPIs.
- Some KPI examples included in this text are SaaS KPIs, marketing KPIs, financial KPIs, and others.
- Creating a KPI dashboard in Excel can help you track your performance against KPI targets, and you can do this by following 5 specific steps. Some FAQs concerning KPIs include what realistic KPIs are, how to use KPI, benefits of setting KPIs, and others.
Table of Contents
What is a Key Performance Indicator (KPI)?
Key Performance Indicators (KPIs) are indicators that show how well you are performing against a predetermined goal or target (or how well your team or entire company is performing). Thanks to KPIs, you can better understand whether you are on the right track towards meeting your final goals and objectives.
For instance, to increase profit margins, a service-based company wants to attract 500 new customers by the end of this year. Therefore, by introducing the KPI, you can find out if you are on track with your original goal — to attract 500 new customers by the end of the year.
In this case, by implementing KPIs into your strategic planning, you may get answers to the questions that will also help you measure your performance, such as:
How many customers did you attract last month or in the last 6 months?
Are you using more resources to achieve this goal than expected?
Are you living up to your customers’ expectations?
If we take the example above into consideration, it becomes clear why KPIs are best described as quantifiable performance measurements that indicate how well an organization is progressing towards a predefined business objective.
Types of KPIs
KPIs can be used across different industries, including sales, operations, customer service, and others.
Therefore, there are plenty of KPI types that can help a business evaluate its performance, and here we’ll make a distinction based on:
- Different levels of organization KPIs apply to, and
- How KPIs can help contribute to an organization.
Type #1: KPIs based on the different levels of organization
According to this first distinction, we typically differentiate between 2 types of Key Performance Indicators based on the different levels of organization they apply to:
- High-level KPIs — they track the overall performance of the organization, and
- Low-level KPIs — they track the performance of separate organization departments, such as marketing, sales, human resources, development, etc.
Type #2: KPIs based on how they help contribute to an organization
According to this distinction, we differentiate between 5 different types of Key Performance Indicators based on how they help contribute to an organization:
1. Input KPIs — they measure the amounts, type, and quality of resources needed to produce certain outputs and monitor resource utilization at the same time. For instance, the cost of employees within an organization.
2. Output KPIs — they measure what is produced as a result of Input KPIs, such as the profit growth, number of goods sold, etc.
3. Process KPIs — they measure the quality and efficiency of equipment and processes involved in the production of certain outputs. For instance, time needed to produce a certain product or provide a service.
4. Project KPIs — they measure and track the status of deliverables and the progress towards milestones in projects. Thanks to KPIs in project management, project managers can have a better grasp of the project’s successes or failures and future developments.
5. Outcome KPIs — they measure the accomplishments that come from your efforts towards an objective. For instance, an increase or decrease in market share.
How do you set KPIs (+ steps)?
Now that you know how to define KPIs and their types, let’s see how KPI implementation works in practice and learn how to set KPIs.
Step #1: Define business objectives for your KPIs
Before you even start thinking about your performance indicators, consider and define the precise business objectives you’ll link them to.
Make sure that these objectives are important for the success of your own business — not just random goals you copied from a famous company you look up to for inspiration.
Remember, unless your chosen objectives are relevant to your own organization, you’ll either be achieving nothing with your efforts, or worse, wasting time and money.
Example: Implement tools to increase employee productivity.
💡 Clockify Pro Tip
While we’re on the subject of setting goals, make sure you check out the following text on how to set and achieve your daily goals, the benefits of setting them, and more:
Step #2: Link your objectives with your KPIs
Now that you’ve ensured your company objectives are relevant and clear, it’s time to connect them to your KPIs.
Each performance measurement should serve as a means to get to a certain goal, and should, as such, be connected to that goal.
On that account, a Performance Measure Specialist, Stacey Barr, suggests no more than three KPIs per goal for one person. This way, she claims, you set goals that are specific, and most of all, make sure you prioritize them according to your needs.
💡 Clockify Pro Tip
Speaking of prioritizing your goals, check out the following blog post on a very practical method for recognizing your priorities and dealing with them:
Step #3: Define success
How do you know you are on the right track to accomplishing your objective?
To obtain this information, you’ll first need to determine what success means for the objectives you’ve previously set.
In other words, you basically need to put key measurable results into your business objective.
Let’s go back to the example we mentioned in Step #1 — Implement tools to increase employee productivity. To actually achieve this, you’ll need to define what success means in regard to your objective.
In this case, the success of this objective may be:
1. Reducing multitasking in the workplace, or
2. Making the daily operations and processes easily manageable.
After you’ve defined the success criteria for your objective, it’s time to measure the success of your objective, which is the next step in setting KPIs.
Step #4: Define how you will measure success
As we’ve already set the success criteria for our objective, it’s time we break them down and see what actual measurements we will use.
The first success criterion — reducing multitasking in the workplace.
In order to measure success in this case, we can limit the number of tasks done within a workday and decide on an optimal number of tasks that should be done per workday (in a way it doesn’t cause the employees to multitask in order to complete everything).
In the second case — to make the daily operations and processes easily manageable — we can conduct employee satisfaction surveys. This way, we’d be able to gauge employee satisfaction while using a newly implemented tool and what they think about its ease of use. This can be done every 6 months, not more frequently than that.
💡 Clockify Pro Tip
If you, on the other hand, want to track how your employees are performing and make use of ready-made templates that would help you get estimates, head on to the text below for more detail:
Step #5: Write your KPIs
Now it’s time to write your KPIs according to the success and measurement criteria that you’ve previously determined.
For that purpose, you can make use of the following formula that may serve you as a guidance when constructing your KPIs:
Action + Detail + Value + Unit + Timeframe
In our case, the KPIs will be:
KPI #1: Track the average number of tasks completed per employee per day.
KPI #2: Assess employee satisfaction when using newly implemented tools every 6 months.
KPI #3: Track employee productivity rate while using newly implemented tools every 6 months.
As you can see from the first KPI example — Track the average number of tasks completed per employee per day — track defines Action, average number of tasks completed per employee per day can be explained as Detail since it basically describes what’s being measured in that KPI.
Next, the average number of tasks completed refer to both Value and Unit, as specific metrics tell us our KPI is measurable.
Finally, per day in this example defines the Timeframe that makes sure our KPI is timely.
Step #6: Track the progress of your KPIs
Once you’ve fully defined your Key Performance Indicators, you’ll need to track your progress against them. This can be on a weekly, biweekly, or monthly basis, depending on the type of short-term KPI targets you want to track.
Furthermore, make sure you include the relevant teams in your company when reviewing KPIs. Go through the numbers together, draw conclusions, and provide and listen to feedback from the teams.
Last but not least, you should always remember that KPIs are not and should not be static — they’ll need to evolve, be updated, and change with your business.
As long as you keep reviewing, readjusting, and updating your KPIs in accordance with your performance and strategic goals of today, you’ll ensure you always have relevant KPI targets worth pursuing.
💡 Clockify Pro Tip
To choose the software to use as a data source for your KPIs, you can also look for inspiration in our previous blog posts, depending on what you want to track and measure:
KPI examples by industry
Now, to help spark your inspiration, here are some KPI examples across different industries and departments.
SaaS KPIs
The following are 4 KPIs that SaaS industries should be monitoring in order to perform better:
1. KPI: Monthly Recurring Revenue (MRR) — your SaaS company’s growth objectives in terms of recurring revenue happening on a monthly basis (e.g., Target: $40,000 MMR).
2. KPI: Quick Ratio — the growth of your startup when compared to the Quick Ratio (the ratio of revenue gains and losses) usually found in Balance Sheets (e.g., Target: your quick assets in the amount of $50,000 / current liabilities in the amount of $10,000 = a quick ratio of 5).
3. KPI: Net Burn Rate — the rate at which the startup uses up its venture capital when compared to the revenue it is generating on a monthly basis (e.g., Target: overhead in the amount of $40,000 – recurring revenue in the amount of $10,000 = net burn in the amount of $30,000).
4.KPI: Net MRR Growth — the rate at which your net recurring revenue is growing on a monthly basis (e.g., Target: (March Net MMR in the amount of $5,000 – April Net MMR in the amount of $4,000) / April Net MMR in the amount of $4,000 x 100 = Net MRR Growth in the amount of 25%).
Marketing KPIs
With regards to the marketing sector, we’ll provide 3 examples for different marketing types, including:
- Digital marketing,
- SEO marketing,
- Social media marketing, and
- Email marketing.
KPI examples in digital marketing
The following are some of the most common examples of digital marketing KPIs:
1. KPI: The conversion rate — the conversion rate of leads, opportunities, and wins (e.g., You had 1,000 visitors on your blog post in the last month and 50 of them purchased a product you were promoting — your conversion rate for that period is 5%).
2. KPI: The monthly revenue — this month’s revenue compared with the previous month’s revenue in terms of the size and growth rate (e.g., Target: $80,000 revenue; 15% growth rate).
3. KPI: The monthly traffic sources — the sessions that were the result of organic traffic, direct traffic, and referrals during the current month (e.g., Targets for sessions: organic search — 20,000; referrals — 10,000; direct search — 5,000).
KPI examples in SEO marketing
Next, we have some top SEO KPIs and metrics that you can track:
1. KPI: Keyword click-through rate (CTR) — the frequency at which your pages appearing on the Search Engine Results Pages (SERPs) generate clicks compared to the number of times they appear (e.g., Target: 5%).
2. KPI: Content backlog — the number of content pieces that are waiting to be published (e.g., Target: 10 blog posts per month).
3. KPI: Pageviews — the number of views individual pages on your website receive (e.g., Target: 1,000 per month on average).
KPI examples in social media marketing
As for social media, here are some of the most prominent KPIs that we selected:
1. KPI: Social events — the interactions your social media activities get, from Twitter retweets to Instagram shares (e.g., Targets: 150 likes and 10 shares on average per Instagram post).
2. KPI: Social sentiment — the type of sentiment (positive, negative, or neutral) your brand is getting across social media platforms (e.g., Targets: positive tweets — more than 75%; negative tweets — less than 5%; neutral tweets — less than 20%).
3. KPI: YouTube channel subscribers — the number of YouTube accounts that are following your channel and receiving notifications about channel updates (e.g., Target: 5k).
KPI examples in email marketing
Next, make use of the email marketing KPIs we outlined for you:
1. KPI: Email subscribers — the number of users who subscribe to your emails (e.g., Target: 10k).
2. KPI: Unsubscribers — the number of users who have previously subscribed to your emails but have unsubscribed since (e.g., Target: less than 20 per month).
3. KPI: Email forwards — the number of times your subscribers have forwarded your emails to their other contacts (e.g., Target: 20 forwards per month).
Sales KPIs
To be able to reach (or exceed) your sales targets, make sure to check out some of the sales KPIs we selected for you:
1. KPI: Sales Growth — the ability of your team to increase revenue during a fixed time period (e.g., Target: 30% growth per month).
2. KPI: Potential new customers — the number of leads the team has contacted (e.g., Target: 500 in a month).
3. KPI: Sales opportunities — the opportunity value of prospects based on the probability to close sales with them (e.g., Target: $70,000).
4. KPI: Missed sales opportunities — the prospects you had but failed to contact (e.g., Target: less than 10% missed).
5. KPI: Sales conversion rate — the success rate of your team to convert leads into customers (e.g., Target: 7%).
6. KPI: Product performance — the sales for individual products ranked to identify the products that are selling well, or those you might want to discontinue (e.g., Target: if a product brings less than $200 per month for 6 months, discontinue it).
7. KPI: Sales per rep — the performance of individual sales reps in your team (e.g., Target: $1,000 worth of sales per rep).
8. KPI: Sales by department — the performance of sales departments in your organization (e.g., Target: $10,000 worth of sales per department).
9. KPI: Sales cycle duration — the time it takes to close a sales deal, from start to finish (e.g., Target: 1 hour).
Financial KPIs
Financial KPIs may be of great importance to financial specialists as they help analyze business operations and track business performance against goals. Here are some of the most prominent financial KPIs:
1. KPI: Current Ratio — the ability of your organization to cover all its short-term financial obligations within 1 year (e.g., Target: total current assets in the amount of $150,000 / total current liabilities in the amount of $50,000 = current ratio of 3).
2. KPI: Working Capital — the financial health of your organization according to your ability to cover short-term financial liabilities (e.g., Target: total current assets in the amount of $150,000 – total current liabilities in the amount of $50,000 = a positive working capital of $100,000).
3. KPI: Vendor expenses — payments you owe to various vendors (e.g., $30,000 in total per quarter).
4. KPI: Net Profit Margin — your organization’s ability to generate a profit on each dollar of revenue (e.g., Target: 15%).
5. KPI: Gross Profit Margin — the profit you make on each dollar of sales before expenses (e.g., Target: 60%).
Support KPIs
Here are some of the most important metrics to track when it comes to customer service KPIs:
1. KPI: Support requests — the data regarding the number of support requests your team gets during fixed time periods (e.g., Target: less than 500 support requests in a month).
2. KPI: Customer satisfaction — the satisfaction level of customers who reach out to your team with support requests (e.g., Target: 95%).
3. KPI: Time per ticket — the time each support agent spends on a ticket (e.g., Target: 15 minutes).
4. KPI: Tickets handled on time — the number of customer tickets handled within a preset amount of time (e.g., Target: 100 tickets handled in the targeted time of 15 minutes per ticket).
5. KPI: Talk Time — the time spent on each support call (e.g., Target: 5 minutes).
6. KPI: Speed of Answer — the time needed to answer an incoming call (e.g., Target: less than 20 seconds).
7. KPI: Total number of complaints received — the number of customer complaints received that center around poor product quality or service (e.g., Target: less than 5 per month).
8. KPI: Queries resolved on the same day — the number of queries resolved on the same day they were received (e.g., Target: 90%).
Human Resources KPIs
Last but not least, human resource KPIs that measure the success of HR processes:
1. KPI: Headcount — the size of your department or organization (e.g., Target: less than 10 per department, and 50 in the organization).
2. KPI: Applicants received per vacancy — the number of applicants you have received for each vacancy in your company (e.g., Target: 20 per vacancy).
3. KPI: Acceptance rate for job offers — the rate at which the job offers you make to prospective employees are accepted (e.g., Target: 85%).
How to create a KPI in Excel
Creating a Key Performance Indicators dashboard in Excel can be a great and easy way to track your performance against relevant KPI metrics and find out which measures to take to make improvements.
But how do you create a KPI dashboard in Excel?
For this purpose, we used a step-by-step method for creating a KPI dashboard in Excel made by Dr. Eugene F.M. O’Loughlin, Lecturer in Computing at the National College of Ireland. His video tutorial shows an easy and efficient way of creating and analyzing a KPI dashboard, and in the following steps we’ll show you how to put it into practice.
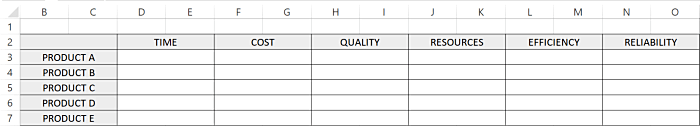
Step 1: Define the KPIs you want to measure (and what you want to measure against them)
In the tutorial example, Dr. O’Loughlin uses the 6 Key Performance Indicators he has previously defined in his book An Introduction to Business Analysis: Problem Solving Techniques and Strategies:
- Time,
- Cost,
- Quality,
- Resources,
- Efficiency, and
- Reliability.
In the example, he uses these performance indicators to track the performance of products.
But you can enter whatever you want to analyze instead of products. You can also implement different Key Performance Indicators.
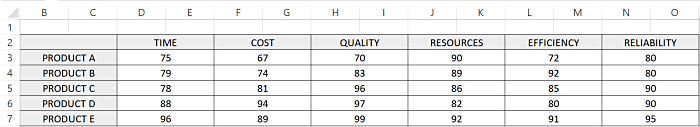
Step 2: Add the values for each element you want to measure against your KPIs
In the example from the tutorial, these elements are products measured against the KPIs of Time, Cost, Quality, Resources, Efficiency, and Reliability. Add the values you think each product deserves for all 6 listed KPIs.
For example, you can add a number from 0 to 100 to score the performance of a product.
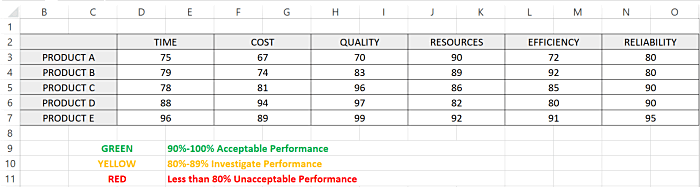
Step 3: Define what each value means
Now that you have the KPI values next to each product, it’s time that you define how you will measure performance:
What values will mean you have an acceptable performance?
What values will mean you need to investigate performance?
What values will mean you have an unacceptable performance?
The scores for values Dr. O’Loughlin proposes are the following:
- 90%–100% indicate acceptable performance,
- 80%–89% indicate investigate performance, and
- Less than 80% indicate unacceptable performance.
Step 4: Make the values visually distinct based on their scores
Next, Dr. O’Loughlin proposes creating a new rule in Excel that marks each added value with a suitable icon to make the values and their scores visually distinct in the dashboard (e.g., you have an Efficiency value of 72 for Product A, and you want to mark it with red to indicate it’s an unacceptable performance).
To create this new rule, do the following:
- Select the values you want to measure against the KPIs in the KPI dashboard,
- In the “Home” tab, click on “Conditional Formatting” in the “Styles” group,
- Select “New Rule” from the dropdown menu,
- Once a new dialogue box opens, select “Icon Sets” in the dropdown menu that describes the format style for all cells based on their value,
- Define the parameters based on the performance scores you defined above (acceptable performance, investigate performance, or unacceptable performance). Make sure it says “Number” as the type of the value,
- Define the green icon to appear each time a value in the dashboard is equal to or more than 90,
- Define the yellow icon to appear each time a value in the dashboard is equal to or more than 80, and
- Once you’ve defined the green and yellow icons in the set, the red icon will automatically appear each time a value is less than 80.
In the end, once you click OK, the appropriate icons will automatically appear next to each value in the KPI dashboard, making the values visually distinct and thus easier to analyze.
Step 5: Draw conclusions from the KPI dashboard
With this KPI dashboard, you’ll be able to take a look at the data and see at a glance whether some products are performing poorer than expected based on their Time, Cost, Quality, Resources, Efficiency, and Reliability.
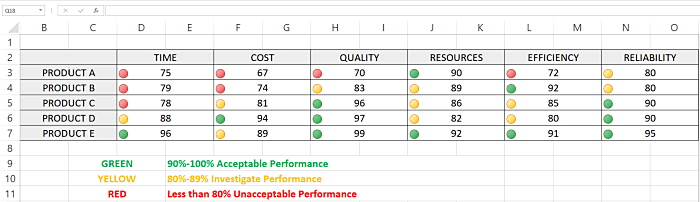
For example, Product A calls for extra attention, considering it has an unacceptable performance in 4 out of 6 KPIs (Time, Cost, Quality, and Efficiency) and a performance in need of investigation for 1 KPI (Reliability).
Moreover, Product E is performing the best, considering it has an acceptable performance in 5 out of 6 KPIs you’re keeping track of (Time, Quality, Resources, Efficiency, and Reliability).
You can use this type of KPI dashboard for any number and type of KPIs and elements you want to measure them against, as long as you understand how you want to score the different levels of performance.
FAQ about Key Performance Indicators (KPIs)
If you haven’t found the answer to your question in the previous part of the text, perhaps you will find it in the section below.
What is a realistic KPI?
Realistic KPIs should be in line with the business goals, and they must give meaningful information when it comes to the performance of such goals. Therefore, realistic KPIs should be neither too challenging nor too easy to achieve.
Which are the best KPIs to use?
The best KPIs to use depend on your business needs and expectations.
However, as a rule of thumb, try to create the KPIs that:
- Align with your business goals (or goals of your department or a team),
- Fit the size and maturity of your business (just because certain KPIs fit the needs of a startup, that doesn’t mean they will be suitable for a more established company),
- Provide insights to help make better decisions, and
- Provide an action plan for achieving your goals.
How are KPIs used in an organization?
KPIs are used across industries to track progress towards achieving a business goal.
There are several steps you need to take to learn how to set KPIs and be able to use them within your organization successfully:
- Step #1: Determine objectives for your KPIs,
- Step #2: Connect the previously determined objectives to your KPIs,
- Step #3: Determine what success means for your objectives,
- Step #4: Think about the specific measurements you will use to measure the success of your objectives, and
- Step #5: Write your KPIs.
Make sure you read the How do you set KPIs? (+ Steps) section from this text to be able to understand each step in more detail and successfully use KPIs.
What are the benefits of setting KPIs?
Apart from measuring performance, success, and other important processes within a company against its goals, Key Performance Indicators have other vital benefits for an organization as they:
- Clarify the current position of an organization and the expectations in terms of future performance,
- Serve as a point of reference you can use to compare past and present performance and draw apt conclusions for the future,
- Outline what is important in a business, thus helping employees focus on achieving this,
- Imply consistent measures you need to take in order to achieve a goal,
- Make employees more accountable for their work by illustrating what represents good performance and what represents underperformance,
- Help maximize resource use and eliminate inefficiencies, and
- Make employees feel more connected with the company’s purpose.
What’s the difference between KPIs and OKRs?
OKRs or Objectives and Key Results is a popular performance, goal management, and strategic framework that is often confused with Key Performance Indicators.
The main difference is that Key Performance Indicators measure the process of your efforts, while Objectives and Key Results measure the outcome of your efforts.
Your OKRs can also help you improve performance on your KPIs, once you realize you are not reaching your targets.
For example, you have a Key Performance Indicator target to reply to each support ticket in 15 minutes. But your real-time time tracking data shows it actually takes you 20 minutes to do so. In light of this knowledge, you can define the following Key Result to encourage you to improve your performance:
I will decrease the amount of time I spend on one support ticket from 20 minutes to 15 minutes within two weeks.
What are SMART KPIs?
SMART KPIs adhere to the SMART criteria, which means that they must be:
- Specific — when a KPI is specific and clear, it’s much easier to track it,
- Measurable — measurable KPIs help you stay on top of your progress,
- Attainable — attainable KPIs are in line with the available resources that a company can offer and, as such, are more likely to be achieved,
- Relevant — relevant KPIs are important to your business goals, and
- Time-bound — time-bound KPIs have a predetermined deadline at which they must be accomplished.
What is the purpose of a KPI?
The main purpose of Key Performance Indicators is to show exactly where your organization stands when compared to what you want to accomplish:
- Are you on track?
- Are you lagging behind?
- Are you ahead?
For example, say that your goal is to reach a total of 50,000 pageviews on your blog 6 months after first going live.
The first 4 months pass, and you find that you have only reached 5,000 pageviews during this time.
By simply glancing at these numbers, you’ll know that you are lagging behind with what you want to accomplish and that you need to assess your work and make plans for the future accordingly (e.g., change your strategy, lower your expectations, or simply work harder).
If you attach certain Key Performance Indicators to all your business objectives, you’ll make it easy to track and assess them in this easy manner as often as you’d like and change your approach to work accordingly.
How many KPIs do you need?
We cannot tell you the exact number of KPIs that you should set for yourself.
The number of KPIs needed depends on your business needs and preferences, mainly on:
- The size of your business,
- The goals or targets you hope to achieve, and
- The resources you currently have at your disposal.
Still, one solution could be to stick to the rule we discussed in the How do you set KPIs? (+ Steps) section, Step #2, and follow Stacey Barr’s suggestion to define three KPIs per goal.
What are leading and lagging KPIs?
Leading KPIs show information about the future performance trends within a company. As such, leading KPIs may serve to predict future outcomes, thanks to which companies may react on time to be able to meet their goals. For instance, some leading KPIs may be the number of new leads in a sales department, website traffic, etc.
On the other hand, lagging KPIs offer us insights into past performances, showing results that were achieved for each past activity. Some examples may include employee turnover, revenue, and others.
Track your time with Clockify while setting goals for your KPIs
Now that you’ve learned how to set KPIs for each objective, try to make sure you track their progression along the way.
This is where Clockify can help you out.
Clockify is a free time tracking tool that may be ideal for tracking your goals, too!
With Clockify’s goal tracker, you can:
- Track time spent on projects and tasks, in relation to your goals,
- Set estimates and deadlines for your goals,
- Track your goal progress to see exactly what measures you can take to course-correct,
- Offer extensive reporting on your goals, and much more.
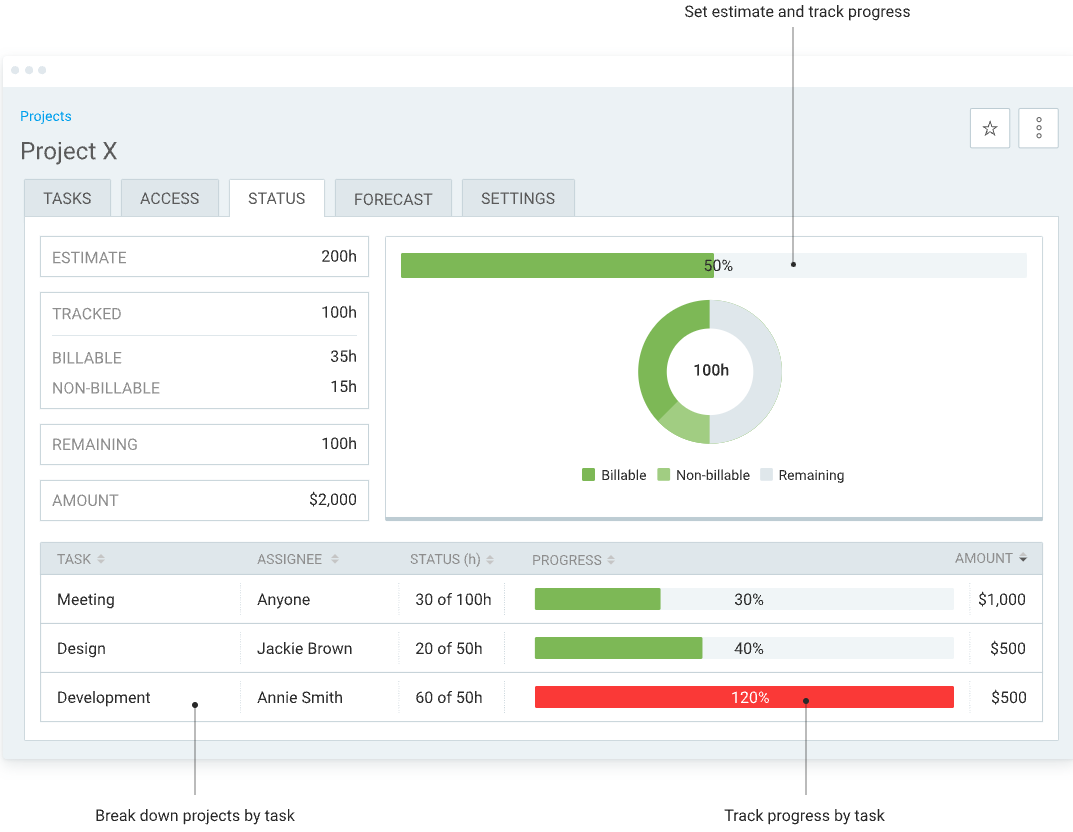
To be able to track progress on projects and get a more detailed breakdown, you must first set estimates (either by time or budget) in Project settings.
After that, in the Projects tab on the left side of the dashboard, you can see the Status section with a detailed summary for each task within a project (estimates, tracked time, progress status, etc.)
Opt for a reliable tool such as Clockify to stay on top of your goals and track their progress in great detail.