Balance Sheet Template
Balance Sheets help you understand financial situation of a company, which you can scrutinize thanks to a simple, clean balance sheet template.
What is a Balance Sheet? What does a Balance Sheet show?
By definition, a Balance Sheet is a financial statement comprised of 3 different sections: Assets, Liabilities, and Equity.
Each Balance Sheet covers a specific point in time and serves as a detailed financial balance showcasing Asset, Liability, and Equity data for an organization or company, during the point in time specified.
In order for a company to draw up a healthy financial balance, you'll likely need to consider the best ways to lower your hourly cost and increase your hourly rate.
What are the 3 parts of a Balance Sheet?
According to the Balance Sheet theory, a standard Balance Sheet consists of 3 main sections:
1. Assets
Assets include all resources the company owns that are of potential economic value in the future.
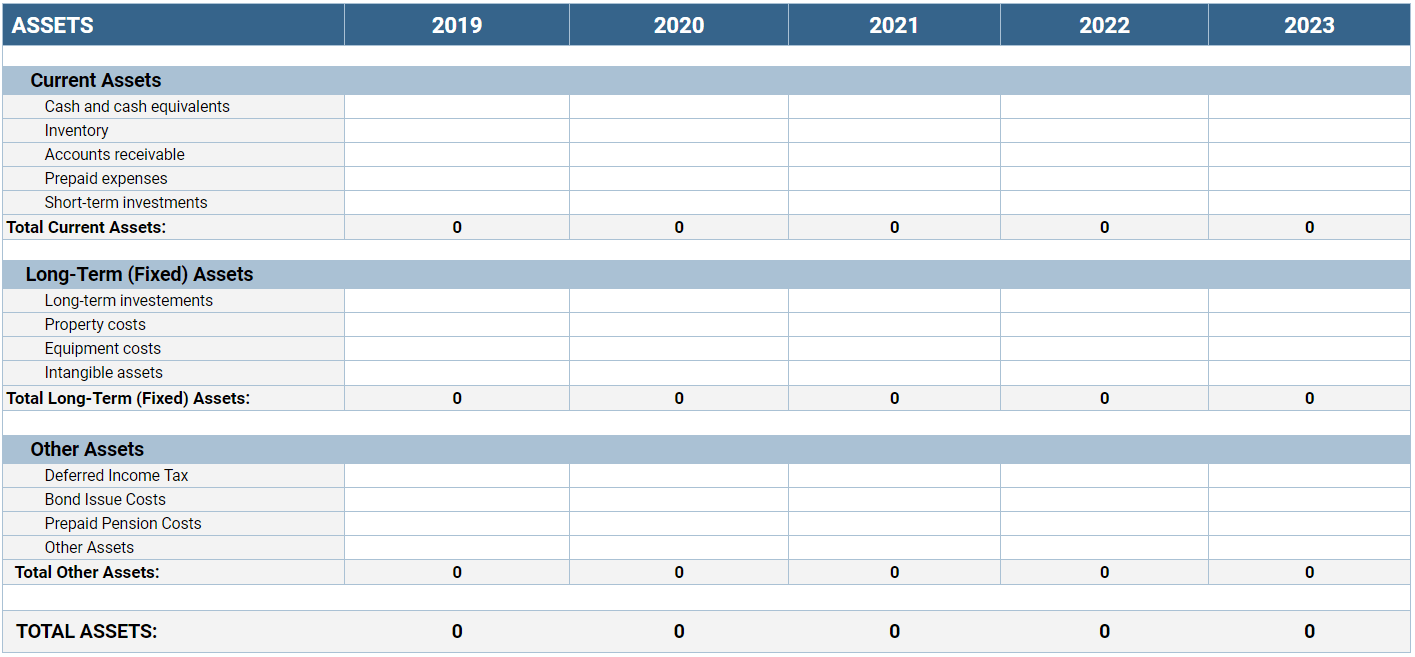
The Assets we usually find on a Balance Sheet are Current Assets, Long-Term (Fixed) Assets, and Other Assets:
Current Assets
These are all the Assets that are intended to convert to cash within one year from the date specified on the Balance Sheet.
Current Assets include:
- Inventory — i.e. all finished goods and raw materials.
- Accounts Receivable— i.e. the balance of money due for the goods and services provided, as well as projects completed, but still not paid by the clients and customers.
- Prepaid Expenses — i.e. all the expenses due for the future, but already paid in advance.
- Cash and Cash Equivalents — i.e. the entire amount of money a company or organization has secured in a bank, in the form of cash, deposit certificates, savings bonds, etc.
- Short-Term Investments (Marketable Securities) — i.e. all securities that can be sold, or converted to cash within a short time period (from 3 to 12 months).
Long-Term (Fixed) Assets
These are all the assets that are NOT intended to convert to cash within one year from the date specified on the Balance Sheet.
Long-Term (Fixed) Assets include:
- Long-term investments — i.e. all stocks, bonds, and cash the company or organization plans to hold for more than 12 months.
- Property costs — i.e. tangible assets such as land and buildings owned by the company and organization.
- Equipment costs — i.e. tangible assets such as machinery, fixtures, and vehicles owned by the company or organization.
- Intangible assets — i.e. all non-physical, long-lasting assets such as patents, trademarks, broadcasting rights, copyrights, etc.
Other Assets
These are all the assets that do NOT fall under Current Assets or Long-Term (Fixed) Assets.
Other Assets include:
- Deferred Tax Income — i.e. the difference between the payable income tax of a company (the result of their accounting methods) and the total tax expenses they report (as ordered by the tax laws).
- Bond Issue Costs — i.e. all the registration and professional fees that come from the issuance of bonds.
- Prepaid Pension Costs — i.e. the result of underfunding or overfunding of the pension funds.
- Other Assets — i.e. all the other assets not listed as Current or Long-Term (Fixed) Assets.
2. Liabilities
Liabilities include everything the company owes to outside parties, from financial debts to specific obligations.
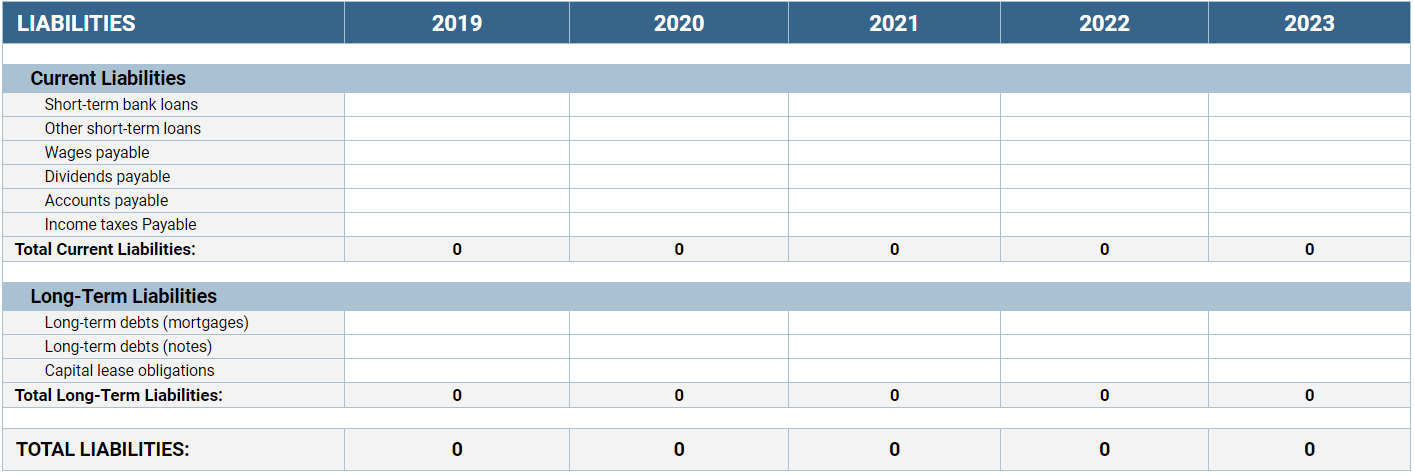
We distinguish between Current Liabilities and Long-Term Liabilities:
Current Liabilities
These are all the amounts due to be paid within one year from the date specified on the Balance Sheet.
Current Liabilities include:
- Short-Term Debts — i.e. all the debts that are supposed to be paid within one year from the date specified on the Balance Sheet, such as bank loans.
- Wages Payable — i.e. al the amounts the employees have earned while working for the company or organization during a specified time period, but that have not yet been paid to them.
- Dividends Payable — i.e. the cash dividends that have been declared within a company or organization, but have yet to be allocated to the stakeholders.
- Accounts Payable — i.e. the money owed to creditors that has to be paid within a short time period, such as 90 days.
- Income Taxes Payable — i.e. all taxes owed to the state and federal governments that need to be paid within one year from the date specified on the Balance Sheet.
Long-Term Liabilities
These are all the amounts that are NOT due to be paid within one year from the date specified on the Balance Sheet.
Long-Term Liabilities include:
- Long-Term Debts — i.e. all debts, mortgages, and notes that are due more than 12 months into the future from the date specified on the Balance Sheet.
- Capital Lease Obligations — i.e. the debts and obligations related to capital lease that are due more than 12 months in the future from the date on the Balance Sheet.
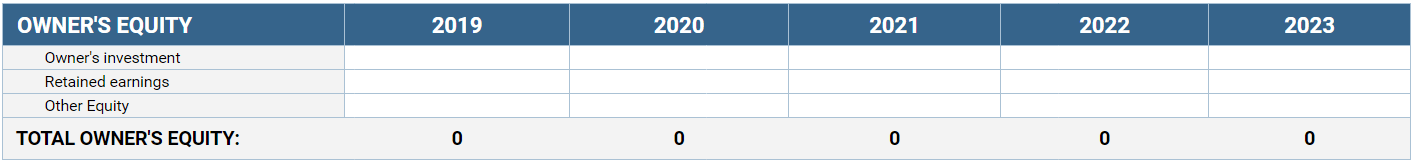
3. Owner's Equity
Owner's Equity (also known as the Shareholders' or Stockholders' Equity) are all the retained earnings that remain when you subtract Total Liabilities (Current and Long-Term Liabilities) from Total Assets (Current and Long-Term Assets). That formula goes as follows:
Total Equity = Total Assets − Total Liabilities
The Owner's Equity also includes the owner's investment.
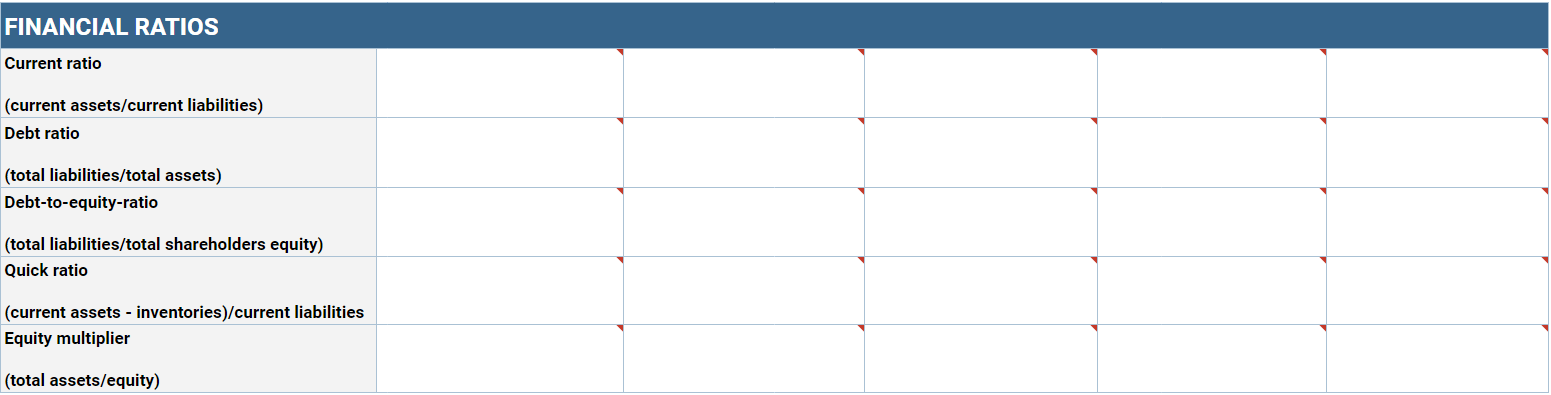
What are Balance Sheet Financial Ratios?
The Financial Ratios on a Balance Sheet are financial metrics that determine the company's or organization's financial position – by using Assets, Liability, and Equity data to carry out the necessary calculations.
The Financial Ratios always determine the relationship between two Balance Sheet components – Assets and Liabilities, Liabilities and Equity, and Equity and Assets:
Assets and Liabilities Financial Ratios
Balance Sheet Financial Ratios that involve the relationship between the Assets and Liabilities include:
The Debt Ratio – the measure that indicates the total amount of assets that are paid by making creditor debts.The Debt Ratio represents the relationship between Total Liabilities and Total Assets, and the formula goes as follows:
The Debt Ratio = Total Liabilities/Total Assets
A good Debt Ratio is usually a ratio of 0.4 (40%) or lower.
The Current Ratio – the measure that indicates a company's ability to pay short-term debts and obligations within a year from the date specified on the Balance Sheet. The Current Ratio represents the relationship between Current Assets and Current Liabilities, and the formula goes as follows:
The Current Ratio = Current Assets/Current Liabilities
A good Current Ratio varies across industries, but it usually falls somewhere between the ratios of 0.015 (1.5%) and 0.03 (3%).
The Quick Ratio – the measure that indicates a company's ability to pay short-term debts and obligations within a year from the date specified on the Balance Sheet, BUT only with its "most liquid assets" (excluding inventory).
The Quick Ratio is the relationship between Current Assets and Current Liabilities, but without the Current Asset Inventories, and the formula goes as follows:
The Quick Ratio = (Current Assets − Inventories)/Current Liabilities
A good Quick Ratio is anything that is equal to or above 1, as it means that you are currently able to cover all your current debts and obligations by using only your most current assets.
Liabilities and Equity Financial Ratios
Balance Sheet Financial Ratios that involve the relationship between the Liabilities and Equity include:
The Debt-to-Equity Ratio – the measure that indicates the amounts the company is indebted to the shareholders.
The Debt-to-Equity Ratio is the relationship between Total Liabilities and Total Shareholders' Equity, and the formula goes as follows:
The Debt-to-Equity-Ratio = Total Liabilities/Total Shareholders' Equity
A good Debt-to-Equity Ratio varies across industries, but it usually falls somewhere between the ratios of
1 and 2.
Equity and Assets Financial Ratios
Balance Sheet Financial Ratios that involve the relationship between Assets and Equity include:
The Equity Multiplier – the measure that indicates the amounts the shareholders provide to cover the company's assets.
The Equity Multiplier represents the relationship between Total Assets and Equity, and the formula goes as follows:
The Equity Multiplier = Total Assets/Equity
As a rule, it's better to have a lower Equity Multiplier, as that means you are financing your own assets more, and not creating debts elsewhere.
How does a Balance Sheet work?
Balance Sheets usually require the following data:
- Your company's name and address
- The date you'll use as a point of reference when deciding whether assets and liabilities are current or long-term
- All relevant Current and Long-Term Assets
- All relevant Current and Long-Term Liabilities
- The Owner's Equity data
- Formulas that help you analyze this data, such as the Balance Sheet Financial Ratios
First, you add your company's basic information.
Then, you add your relevant Current and Long-Term Assets And Liabilities, as well as the Owner's Equity data.
Once you've done that, you may need to calculate the relevant Financial Ratios, and other similar data, on your own.
However, if you're using a Balance Sheet Template created in Excel or Google Sheets, you'll be able to add the formulas that will make these calculations for you.
So, when you enter your data about Assets, Liabilities, and Equity, the Financial Ratios will be calculated automatically. In addition, you can download a Balance Sheet, save as PDF, print out the template, and fill it out by hand.
How does a Balance Sheet look like?
A straightforward and comprehensive Balance Sheet is parsed by the type of data.
For example, both the Assets and Liabilities are parsed into Current and Long-Term Assets and Liabilities. Moreover, the Owner's Equity data is also sectioned separately.
The purpose of this is to allow for a quicker and simpler insight into the working capital of a company or organization, as well as to facilitate the relevant Financial Ratio calculations.
Why is a Balance Sheet important? Why is a Balance Sheet used?
A Balance Sheet is an important aid in helping:
- Potential investors in a business
- The companies running the said business
By glancing at a Balance Sheet, business people gain insight into their potential investments as well as the current state of their own businesses:
- The investors gain an insight into the operations and workings of a certain company – the Balance Sheet data helps potential investors decide whether they should invest in a company, or not.
- The companies understand their financial standing – the Balance Sheet data helps owners understand how much they own, how much they owe, how much they are owed, and whether their business is solvent, or not.
Why is a Balance Sheet prepared?
As evident, a Balance Sheet is usually prepared to serve as a report of a company's or organization's financial standing at the end of a specific accounting period.
For example, a completed Balance Sheet may be required before midnight on the 31st of December. Such a Balance Sheet is used to cover the Assets, Liabilities, and Equity for the whole previous year.
How do you create and structure a Balance Sheet template?
You can create a reusable Balance Sheet Template in Excel or Google Sheets:
-
First, you add your company's basic data and the date you'll use as a point of reference to decide whether the Assets and Liabilities are Current or Long-Term:
-
Then, you add your relevant Assets, both Current and Long-Term:
-
Afterward, you add your relevant Liabilities, both Current and Long-Term:
-
In the end, you add your relevant Equity data:
-
Once you've added all these data, you'll use it to calculate Total Assets, Total Liabilities, and Total Equity. In addition, you'll use it to calculate the Financial Ratios, as well as understand how your company is performing, and whether you'll need to take some action to improve its position (and, potentially, save it from bankruptcy).
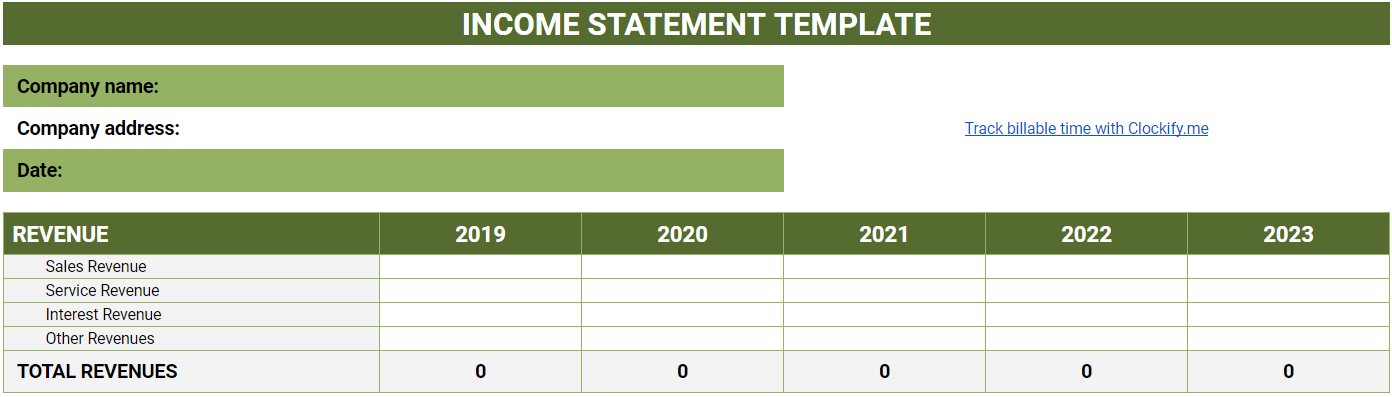
Is a Balance Sheet an income statement? What is an Income Statement?
Balance sheets are NOT income statements, but they do closely relate - together, they represent an entity's Total Financial State. As such, they are usually observed and analyzed together.
An Income Statement, by definition, is the relationship between the inpour of resources (Revenue) and the output of resources (Expenses).
The Revenue section of an Income Statement may include:
- sales revenue
- service revenue
- interest revenue
- other types of revenue
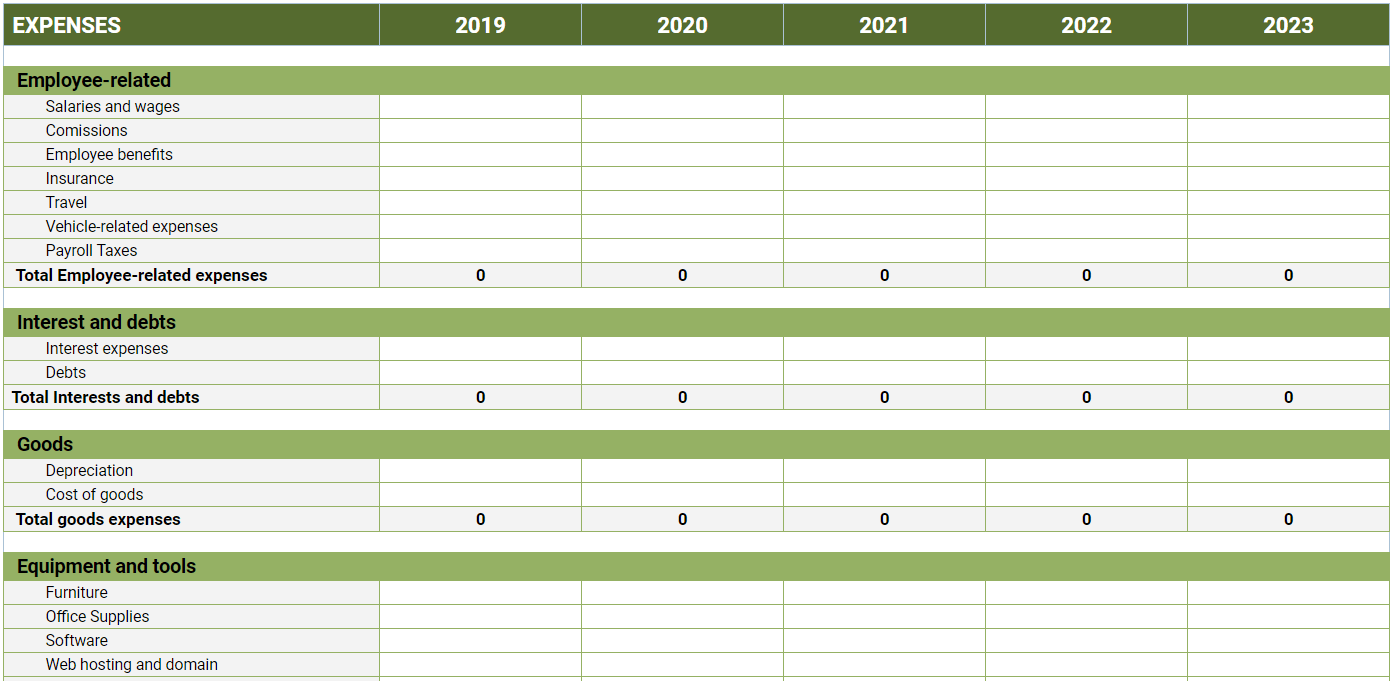
The Expenses section of an Income Statement is more variable, and typically includes:
- commissions
- employee benefits
- advertising
- software costs
- rent
- equipment
- other types of expenses
To draw up your Income Statement, you'll need to subtract your Total Expenses from your Total Revenue.
An Income Statement serves as a summary of all Revenues and Expenses during a specific time period.
This specific time period is usually a year, but it may also be shorter than that, like a quarter of the year.
When the Revenue is higher than the Expenses, their relationship is labeled as Net Income. This is the amount the company has gained during the specified time period.
Here's an example of an income statement calculation, when the outcome is Net Income:
Revenue = $5,000
Expenses = $3,000
Revenue - Expenses = Net Income
$5,000 - $3,000 = $2,000 of Net Income
When the Revenue is lower than the Expenses, their relationship is labeled as Net Loss. This is the amount the company has lost during the specified time period.
Here's an example of an income statement calculation, when the outcome is Net Loss:
Revenue = $5,000
Expenses = $6,000
Revenue - Expenses = Net Loss
$5,000 - $6,000 = $-1,000 of Net Loss
Is a Balance Sheet a financial statement? What is a Financial Statement?
A Balance Sheet is NOT an Income Statement, but both a Balance Sheet and an Income Statement are Financial Statements.
Financial Statements serve as formal records that show the financial standing of a business or an individual during a specific time period.
For easier management and reading, all Financial Statements, including Balance Sheets and Income Statements, are laid out in a straightforward and structured manner.
Download templates
Balance Sheet Template
Creating a reusable Balance Sheet Template in Excel with formulas on your own can be time-consuming and lead to a number of errors.
For this reason, it's best that you use a ready-made Balance Sheet Template, where all calculations are carried out automatically.
Here, you'll find a simple Balance Sheet Template where you can simply add your relevant Assets, Liabilities, and Equity, and then watch their Totals, as well as your Financial Ratios, get calculated automatically. It's suitable for a number of business formats, so you can use it as a personal Balance Sheet Template, a Balance Sheet for a private company, or for a small business.
Income Statement Template
In order to have a larger picture of your financial status, you can also use the following Income Statement Template, where all Revenue and Expense data, as well as your Net Income (Loss), is also automatically calculated.
Fill out your Balance Sheet, with the help of Clockify by CAKE.com
Clockify can help you make the job of handling your Balance Sheet and completing your additional Financial Statements easier:
- Track your billable time, and view it separated from non-billable time
- Define employee hourly rates, and have your employees track their work time to have their hourly wages calculated automatically – for an easy overview of Wages Payable
- Track employee progress on projects as they work
- Use time tracking data to calculate Payroll
- Analyze project profitability based on the time spent/money earned ratio
- Export employee timesheets and further manage and analyze this data

Samples: Excel • CSV • Google Sheets