Average Working Hours by Country: 2026 Statistical Data
If you’re managing a distributed team for the first time or you’re about to hire in a new country, you should inform yourself about average working hours in that country.
To help you understand working hours by country, this guide provides statistics on global working hours and paid time off, with graphs and expert insights.

10 Most important statistics about average working hours
Here are the most important statistics on average working hours:
- The Fair Labor Standards Act of 1938 introduced overtime pay for any hour worked over 40 hours per week.
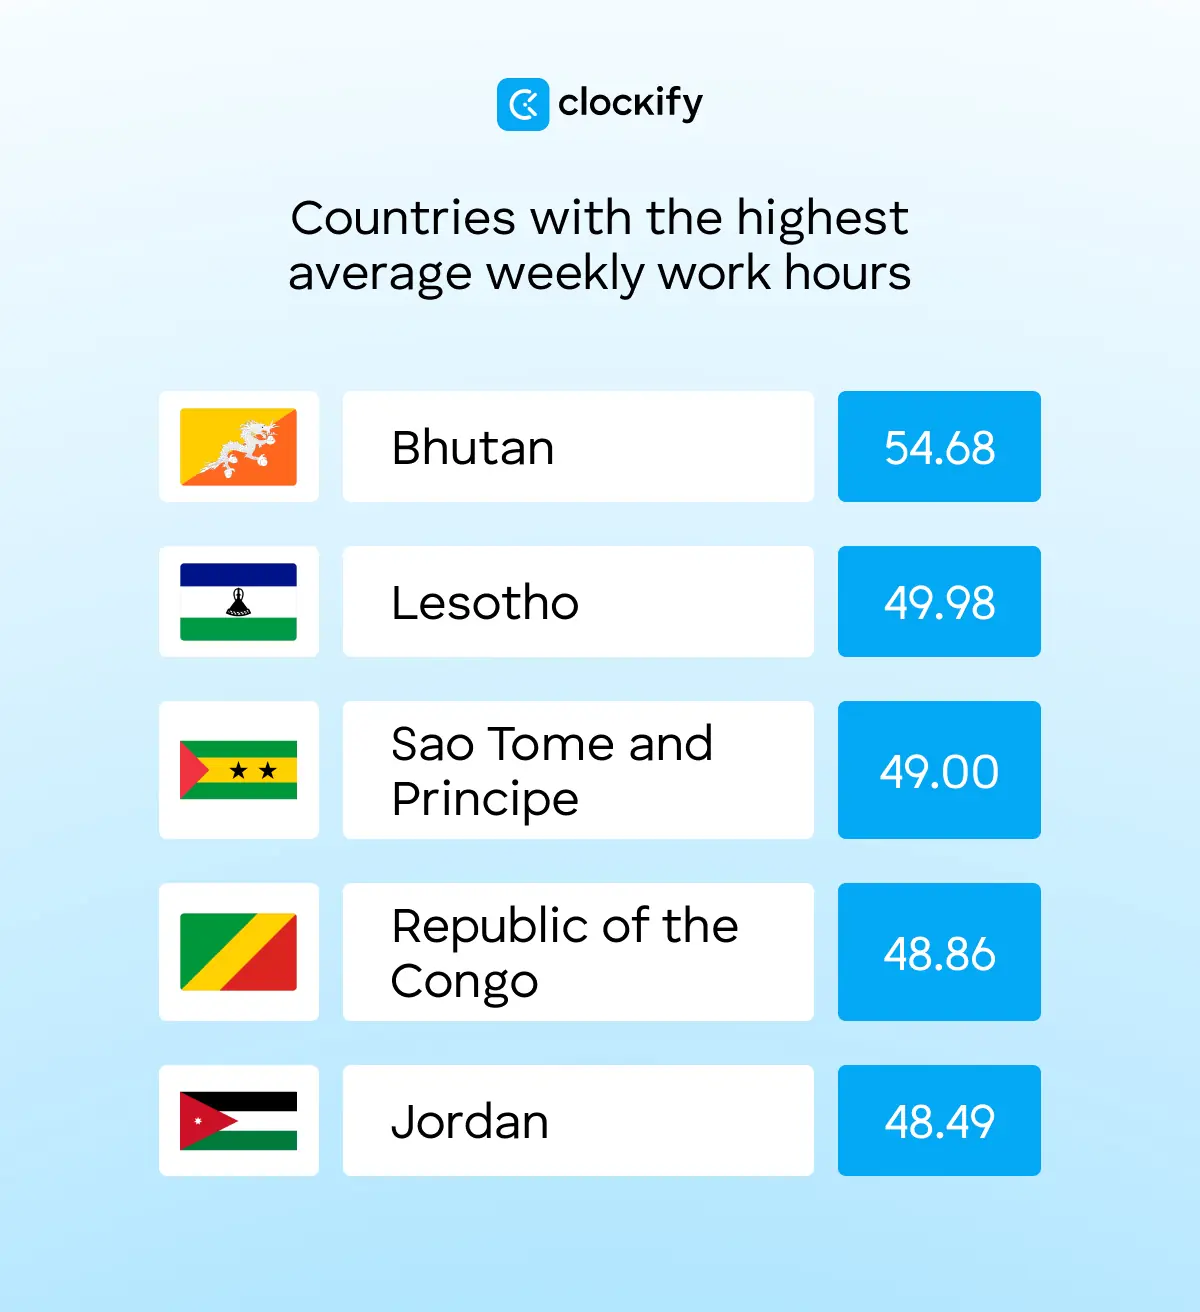
- The country with the highest number of working hours per week (54.68 hr) is Bhutan.
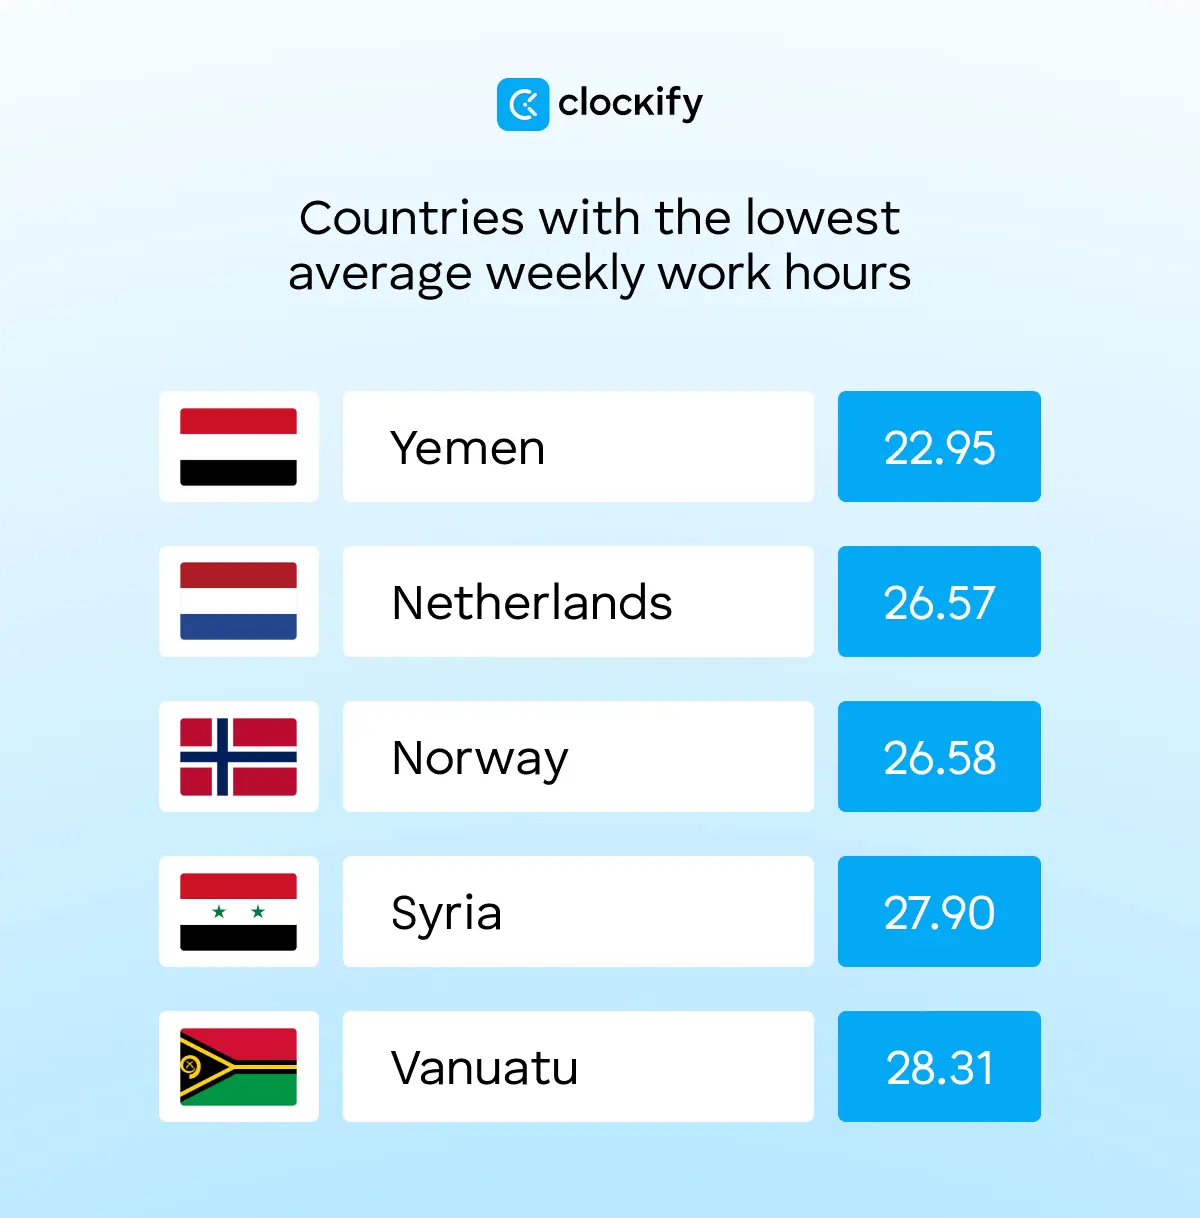
- The country with the lowest number of working hours per week (22.95 hr) is Yemen.
- Among OECD countries, workers in Mexico worked 2,205 hours in 2025.
- Another OECD country, Germany, reported the lowest number of working hours per year — 1,332.
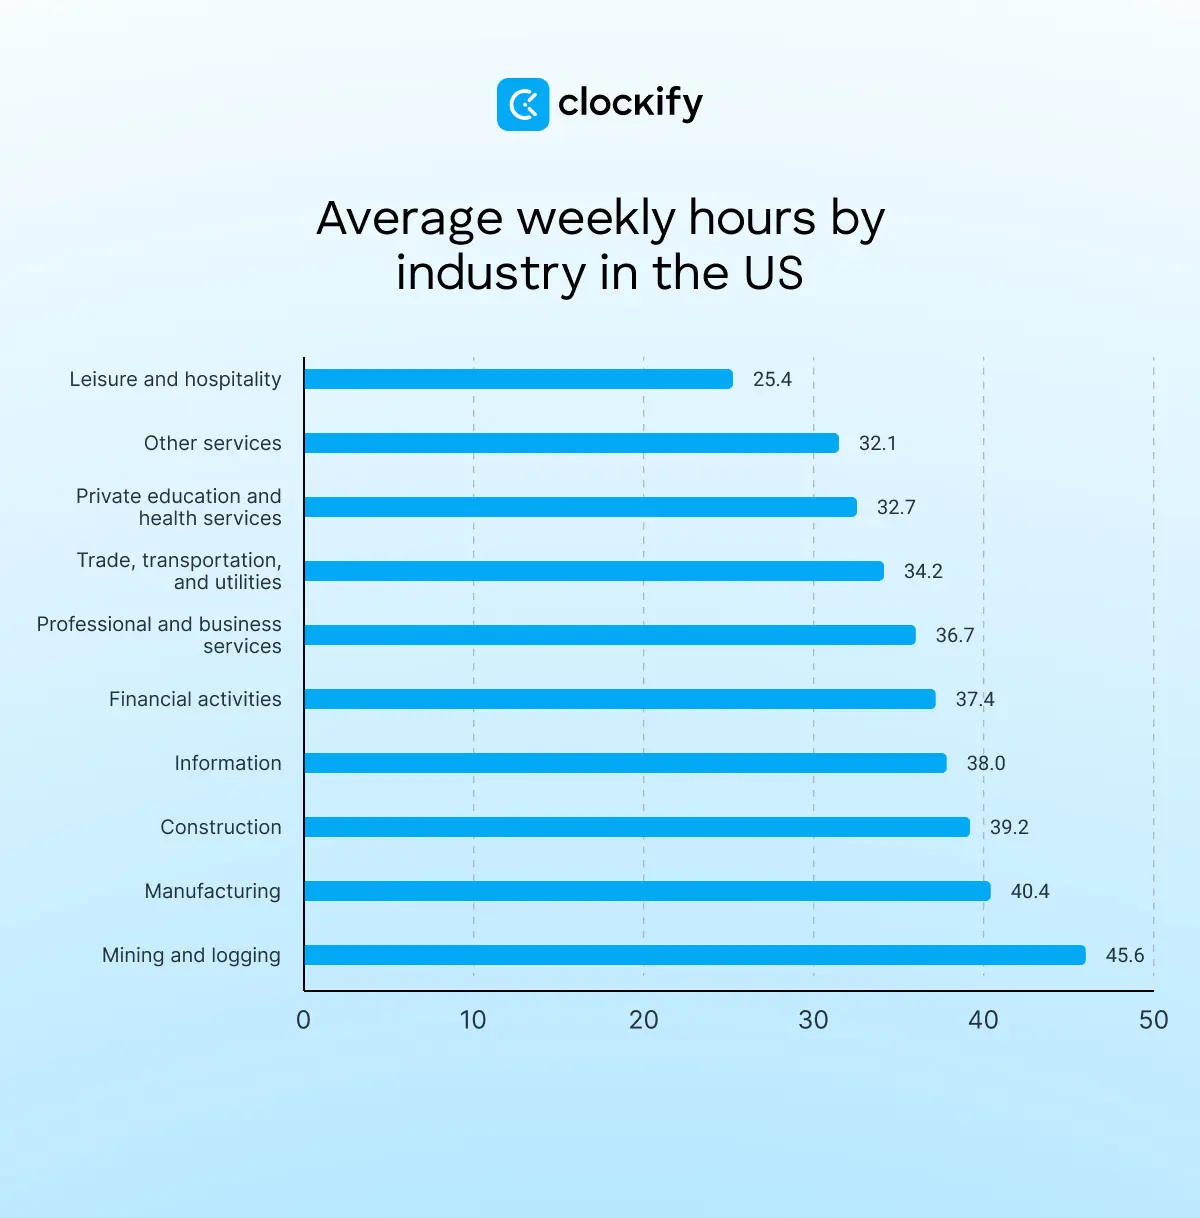
- In the US, the industry with the longest hours is mining and logging — 45.6 hours per week in May 2026.
- In the US, the industry with the fewest working hours per week is leisure and hospitality — 25.4 hours in May 2026.
- The average working hours in Japan are 31.10 hours per week.
- The average working hours in China are 44.60 hours per week.
- The average working hours in India are 45.69 hours per week.
Working hours through history
Average work hours in developed countries fell from 3,400 hours per year in 1870 to between 1,400 and 2,600 hours per year by 1990.
In the US, the drop in working hours was due to the Fair Labor Standards Act of 1938. President Roosevelt signed the law setting the number of working hours per week at 35–40. Also, this law introduced overtime pay for any hours worked beyond 40 hours per week.
🎓 A Guide to Overtime Pay + Free Overtime Calculator
Globally, the number of working hours has been decreasing since the Industrial Revolution. The process of adopting machine manufacturing began in the late 19th century in the United States and Western Europe. On the other hand, countries like China and India underwent this economic transformation in the 20th century.
| Period | Work hours |
| 1870 | 2,755–3,483 hours |
| 1900 | 2,385–3,115 hours |
| 1950 | 1,795–2,787 hours |
| 1990 | 1,410–2,674 hours |
| 2010 | 1,349–2,633 hours |
| 2020 | 1,314–2,599 hours |
During the 1940s, employees started having 2 days off per week, instead of just Sunday.
Apart from weekends, the number of vacations and holidays in early industrialized countries began to increase in 1870. For example, in the Netherlands, the number of days off (vacation and holidays) changed from 4 in 1870 to almost 38 days per year in 2000.
Since workers have been using their holidays and vacation days to rest, the number of work hours per year has gradually decreased over the last decade.
When it comes to paid time off and vacation, you can use a PTO tracker like Clockify by CAKE.com to keep tabs on your days off. Clockify allows you to set up PTO and vacation policies, see who’s on leave, and track time off balance.
Global working hours statistics
Here are the top 10 countries worldwide with the highest average work hours per week in 2026, according to the International Labour Organization (ILO).
| Countries with the highest weekly working hours | Average weekly hours worked 2026 | Average annual hours worked (predictions for 2026)* | Average weekly hours: Men | Average weekly hours: Women |
| Bhutan | 54.68 | 2.898 | 55.30 | 53.77 |
| Lesotho | 49.98 | 2.649 | 51.39 | 48.08 |
| Sao Tome and Principe | 49.00 | 2.597 | 47.89 | 50.12 |
| Republic of the Congo | 48.86 | 2.590 | 49.37 | 48.30 |
| Jordan | 48.49 | 2.570 | 48.82 | 46.99 |
| United Arab Emirates | 48.28 | 2.559 | 48.24 | 48.42 |
| Burkina Faso | 48.19 | 2.554 | 50.88 | 45.06 |
| Liberia | 48.12 | 2.550 | 49.59 | 46.51 |
| Pakistan | 47.63 | 2.524 | 51.28 | 35.05 |
| Mongolia | 46.58 | 2.469 | 49.24 | 43.21 |
*The average annual working hours in the table are the average weekly hours provided by the International Labour Organization multiplied by 52 (the number of weeks in 2026).
The following table shows the top 10 countries with the lowest average hours worked per week.
| Countries with the lowest weekly working hours | Average weekly hours worked 2026 | Average annual hours worked (predictions for 2026)* | Men | Women |
| Rwanda | 29.30 | 1.553 | 31.76 | 26.43 |
| Sweden | 29.20 | 1.548 | 31.15 | 27.05 |
| Austria | 29.15 | 1.545 | 32.70 | 25.14 |
| Finland | 29.10 | 1.542 | 31.50 | 26.54 |
| Denmark | 28.91 | 1.532 | 31.38 | 26.15 |
| Vanuatu | 28.31 | 1.500 | 27.87 | 28.85 |
| Syria | 27.90 | 1.479 | 29.44 | 18.96 |
| Norway | 26.58 | 1.409 | 28.65 | 24.27 |
| Netherlands | 26.57 | 1.408 | 30.09 | 22.61 |
| Yemen | 22.95 | 1.216 | 23.45 | 14.85 |
*The average annual working hours in the table are the average weekly hours provided by the International Labour Organization multiplied by 52 (the number of weeks in 2026).
Working hours in North America
Here are the average working hours in the United States and Canada.
Working hours in the US
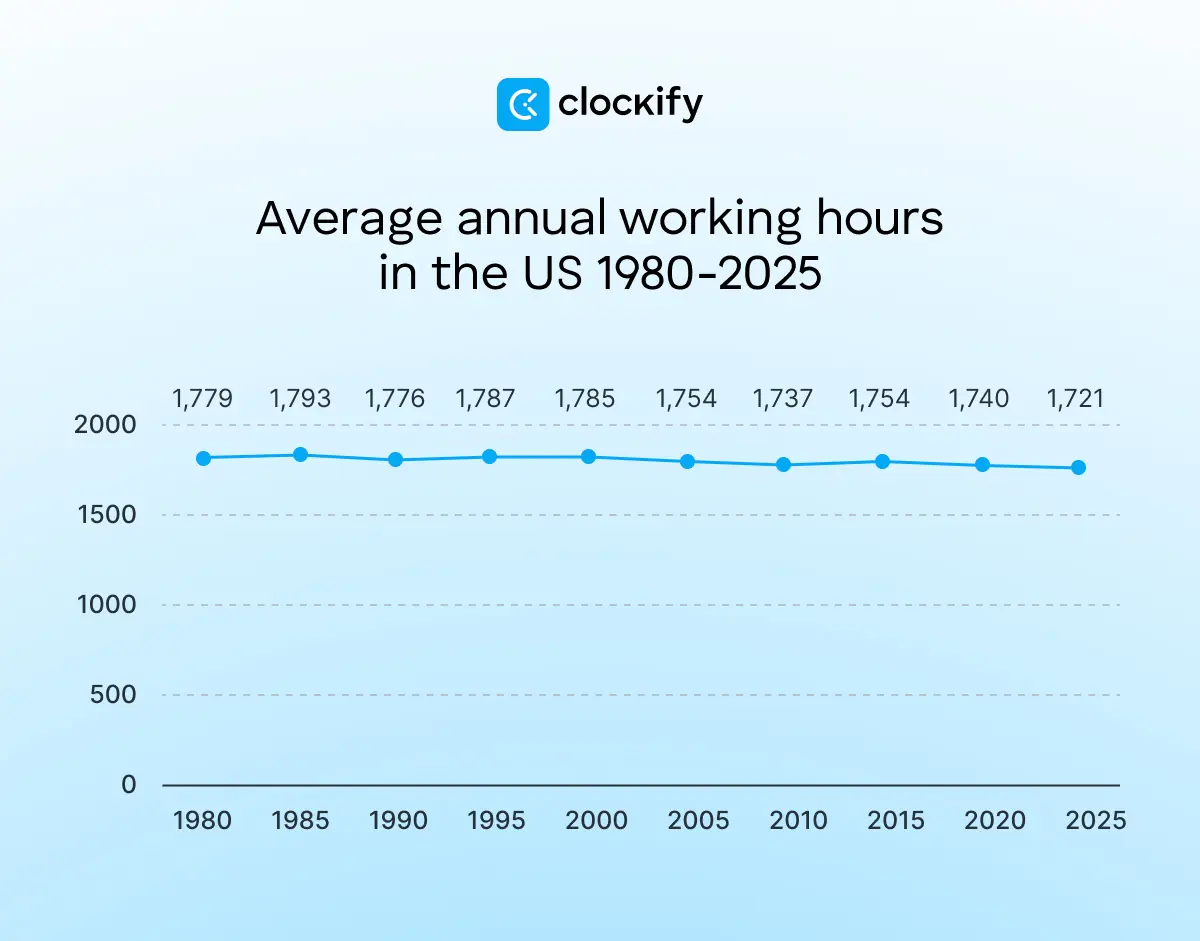
According to 2026 data from the US Bureau of Labor Statistics, a full-time employee in the United States worked 1,721 hours in 2025, averaging 33.1 hours per week.
Compared with the OECD average of 1,736 annual hours worked, employees in the US clocked fewer hours in 2025.
The Fair Labor Standards Act (FLSA) doesn’t define the number of weekly hours an employee must work to be considered a full-time worker. However, the Internal Revenue Service (IRS) states that full-time employees work at least 30 hours per week (130 hours per month).
Overtime, on the other hand, is FLSA-regulated at more than 40 work hours per week.
Working hours statistics by industry in the US
The most recent BLS data on average weekly hours by industry in the US show that employees working in mining and logging worked the longest hours — 45.6 in May 2026.
CEO of Fuel Logic Eliot Vancil told us that extraction industries have high average weekly hours because of their high levels of heavy machinery utilizationand adds:

“Enterprises make use of 12-hour shifts to be able to enhance the daily production. This programmatic schedule will automatically change the baseline to >40 hours. This is not feasible with short shifts because crews need to be relocated to remote areas.”
In other words, workers would sometimes be required to work overtime in one deployment period. Overtime hours have to be tracked regularly to ensure accurate overtime pay and compliance with the FLSA. Keeping track of your and your employees’ standard and overtime hours with Clockify is an easy and reliable way to manage payroll.
On the other hand, leisure and hospitality workers in the US have the fewest working hours — 25.4 hours in May 2026.
Expert contributor Eliot Vancil says the main reason is the unpredictability of the leisure and hospitality industry.
🎓 How Many Work Hours Do You Work in a Year?
Working hours in Canada
A Canadian full-time employee works 38.8 hours a week, while a part-time employee works 18.6 hours a week on average, according to Statistics Canada for 2025.
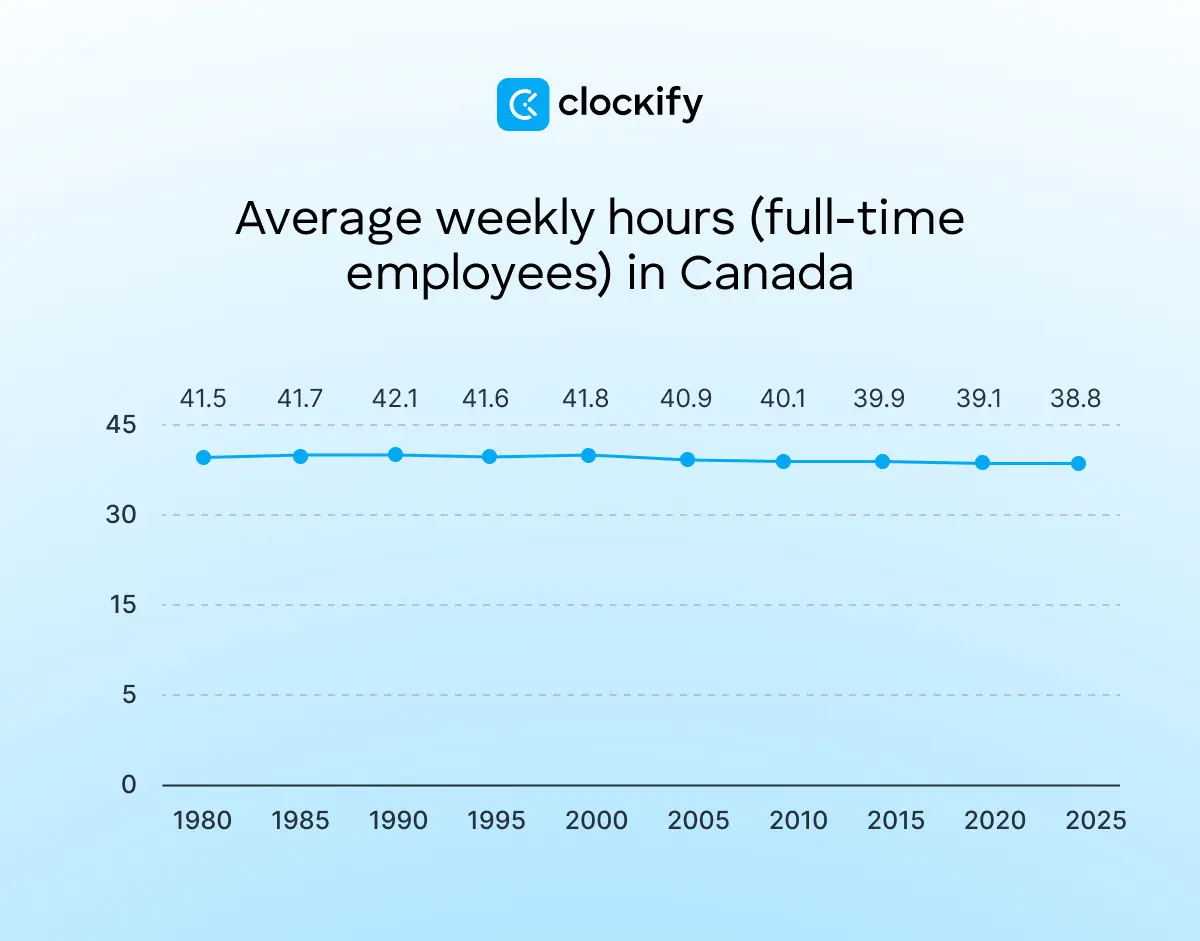
Compared to 1980, there’s a slight decrease (2.7 hr) in the number of working hours per week for full-time employees in Canada.
In general, this decrease in the number of working hours can be attributed to work-life balance. To Isidora Mirosavljevic, Employee Experience Specialist at CAKE.com, modern workplaces respect the balance between work and personal life:

“In the 1980s, employees used to work at least 40 hours per week and often had overtime work. But, nowadays, people are more aware of mental health and we’re trying to prevent workplace burnout. To be in line with such workplace trends, many private companies and public institutions have introduced more flexible working models, resulting in shorter workweeks.”
Isidora also says that, due to automation and digitalization, there are more flexible working models and job positions that don’t demand working strictly for 40 hours.
Working hours in OECD countries
Currently, there are 38 OECD countries: Australia, Austria, Belgium, Canada, Chile, Colombia, Costa Rica, Czech Republic, Denmark, Estonia, Finland, France, Germany, Greece, Hungary, Iceland, Ireland, Israel, Italy, Japan, Korea, Latvia, Lithuania, Luxembourg, Mexico, Netherlands, New Zealand, Norway, Poland, Portugal, Slovak Republic, Slovenia, Spain, Sweden, Switzerland, Türkiye, UK, and USA.
Average annual working hours in OECD countries
On average, a full-time employee in an OECD country works 1,736 hours per year.
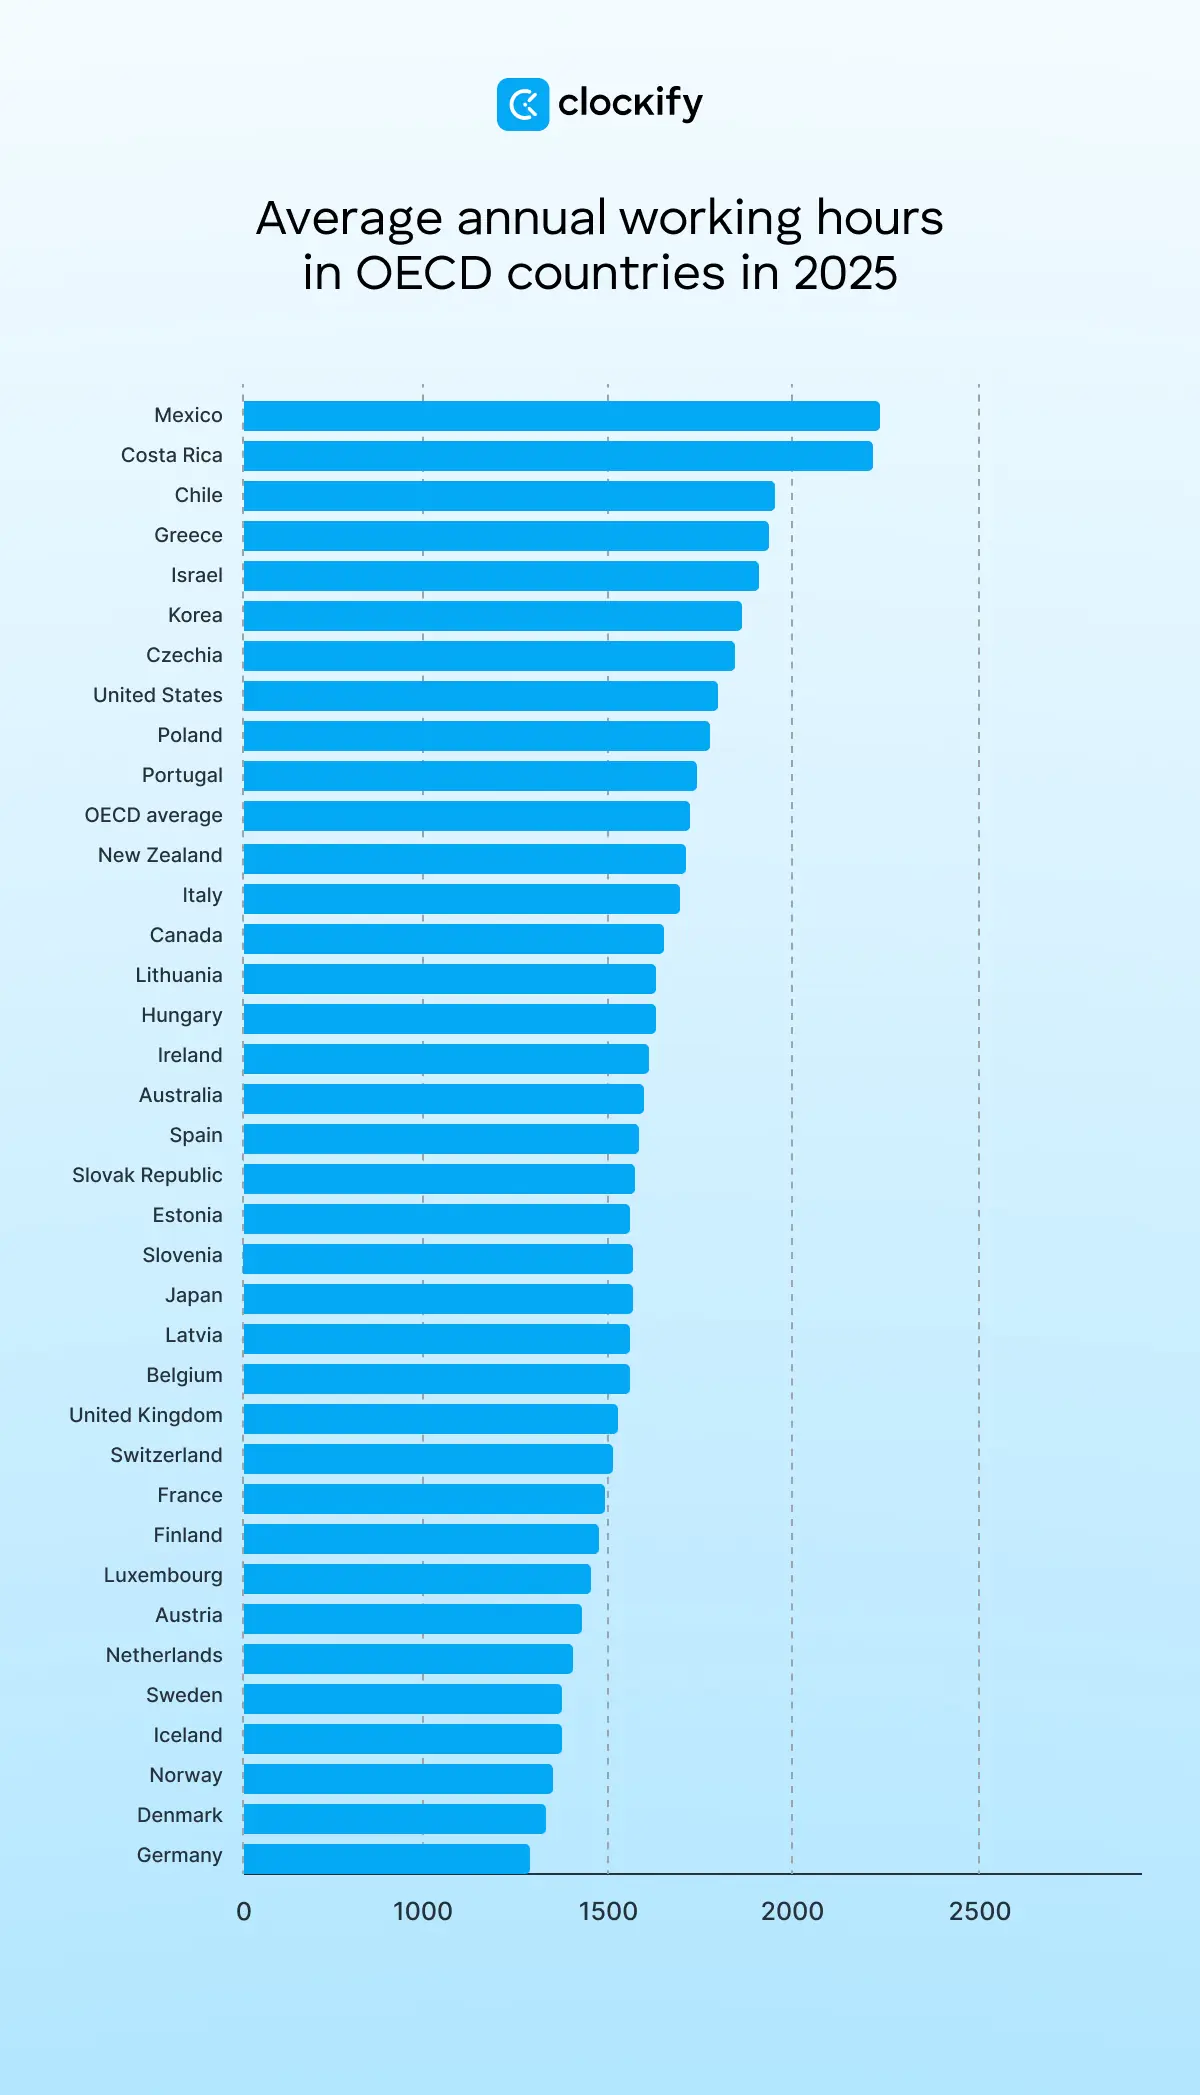
OECD countries with the highest average working hours are usually developing countries — those with low living standards and lower incomes (such as Colombia, Costa Rica, and Mexico).
The reason developing countries have higher average monthly working hours isn’t solely economic. Our expert contributor Babak Hafezi, Adjunct Professor of International Business at American University, says that there are more factors involved:

“Higher weekly working hours are generally the result of cultural, structural, and economic decisions aimed at ensuring affordability. In developing countries, workers' rights, union membership, and employment laws are weaker or less enforced (where they exist). Thus, employees need to work longer hours to meet basic living and affordability needs.”
Hafezi adds that in developing countries, “the informal economy (grey economy) makes employment laws unenforceable.”
On the other hand, a developed country such as Germany, which has the world's third-largest economy, has the lowest average annual working hours (1,332 hr). This shows that countries with greater Gross Domestic Product (GDP) per capita also have fewer working hours. GDP measures the goods and services produced by a region, country, or group of countries over a quarter or a year.
Average working hours per month: OECD countries
In the OECD, average monthly working hours range from 111 hours in Germany to 184 hours in Mexico.
| Country | Average working hours per month |
| Mexico | 184 |
| Costa Rica | 182 |
| Chile | 159 |
| Greece | 156 |
| Israel | 156 |
| Korea | 153 |
| Czechia | 152 |
| United States | 150 |
| Poland | 148 |
| Portugal | 147 |
| OECD average | 145 |
| New Zealand | 143 |
| Italy | 143 |
| Canada | 140 |
| Lithuania | 139 |
| Hungary | 139 |
| Ireland | 136 |
| Australia | 136 |
| Spain | 136 |
| Slovak Republic | 135 |
| Estonia | 134 |
| Slovenia | 133 |
| Japan | 133 |
| Latvia | 132 |
| Belgium | 132 |
| United Kingdom | 128 |
| Switzerland | 126 |
| France | 125 |
| Finland | 124 |
| Luxembourg | 122 |
| Austria | 120 |
| Netherlands | 119 |
| Sweden | 118 |
| Iceland | 118 |
| Norway | 115 |
| Denmark | 114 |
| Germany | 111 |
Adjunct Professor Babak Hafezi says that we need to differentiate between technology-based economies and agriculture- and manufacturing-based economic systems:
“In the developed world, technology transcends industries, be it manufacturing, agriculture, or office-based employment, with tools for efficiency being a critical component of the workforce, allowing for more efficiency in work and fewer hours of work. In developing economies, human capital lacks the tools to drive efficiency, so longer hours are necessary to complete the same workload.”

Working hours in Europe
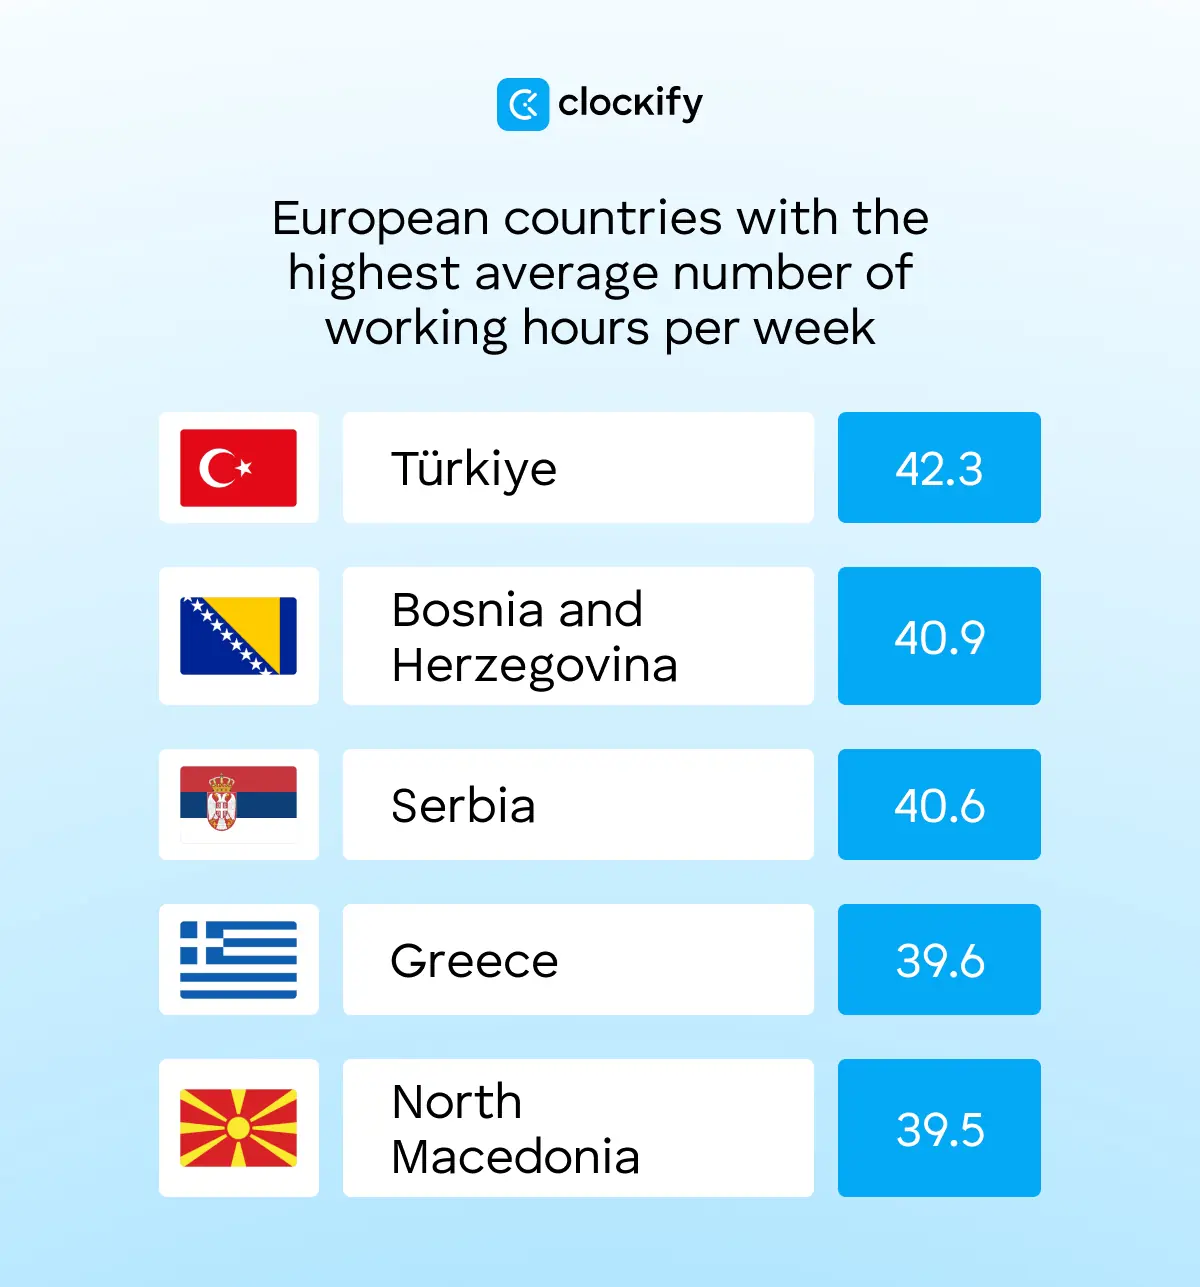
According to the statistics from Eurostat, Türkiye has the highest average number of hours spent on the main job, at 42 hours. Besides Türkiye, Balkan countries such as Bosnia and Herzegovina and Serbia are among the top 5 countries with the highest number of working hours in Europe.
The Eurofound study on job quality and working conditions in the Western Balkans also shows long working hours in the Balkans — over 40 hours per week and 6 or 7 days a week.
| Country | Hours |
| Türkiye | 42.3 |
| Bosnia and Herzegovina | 40.9 |
| Serbia | 40.6 |
| Greece | 39.6 |
| North Macedonia | 39.5 |
| Bulgaria | 38.7 |
| Poland | 38.7 |
| Lithuania | 38.4 |
| Romania | 38.2 |
| Slovenia | 38.2 |
| Latvia | 37.9 |
| Croatia | 37.7 |
| Cyprus | 37.6 |
| Czechia | 37.5 |
| Slovakia | 37.5 |
| Malta | 37.4 |
| Portugal | 37.4 |
| Hungary | 37.3 |
| Spain | 36.2 |
| Estonia | 36.0 |
| Italy | 36.0 |
| Switzerland | 36.0 |
| European Union (average of 27 countries in the EU) | 35.7 |
| France | 35.5 |
| Luxembourg | 35.5 |
| Euro area (average of 21 countries that have adopted the euro as their currency) | 35.2 |
| Sweden | 34.9 |
| Iceland | 34.9 |
| Ireland | 34.4 |
| Finland | 34.2 |
| Belgium | 34.0 |
| Austria | 33.9 |
| Germany | 33.8 |
| Norway | 33.1 |
| Denmark | 32.8 |
| Netherlands | 30.7 |
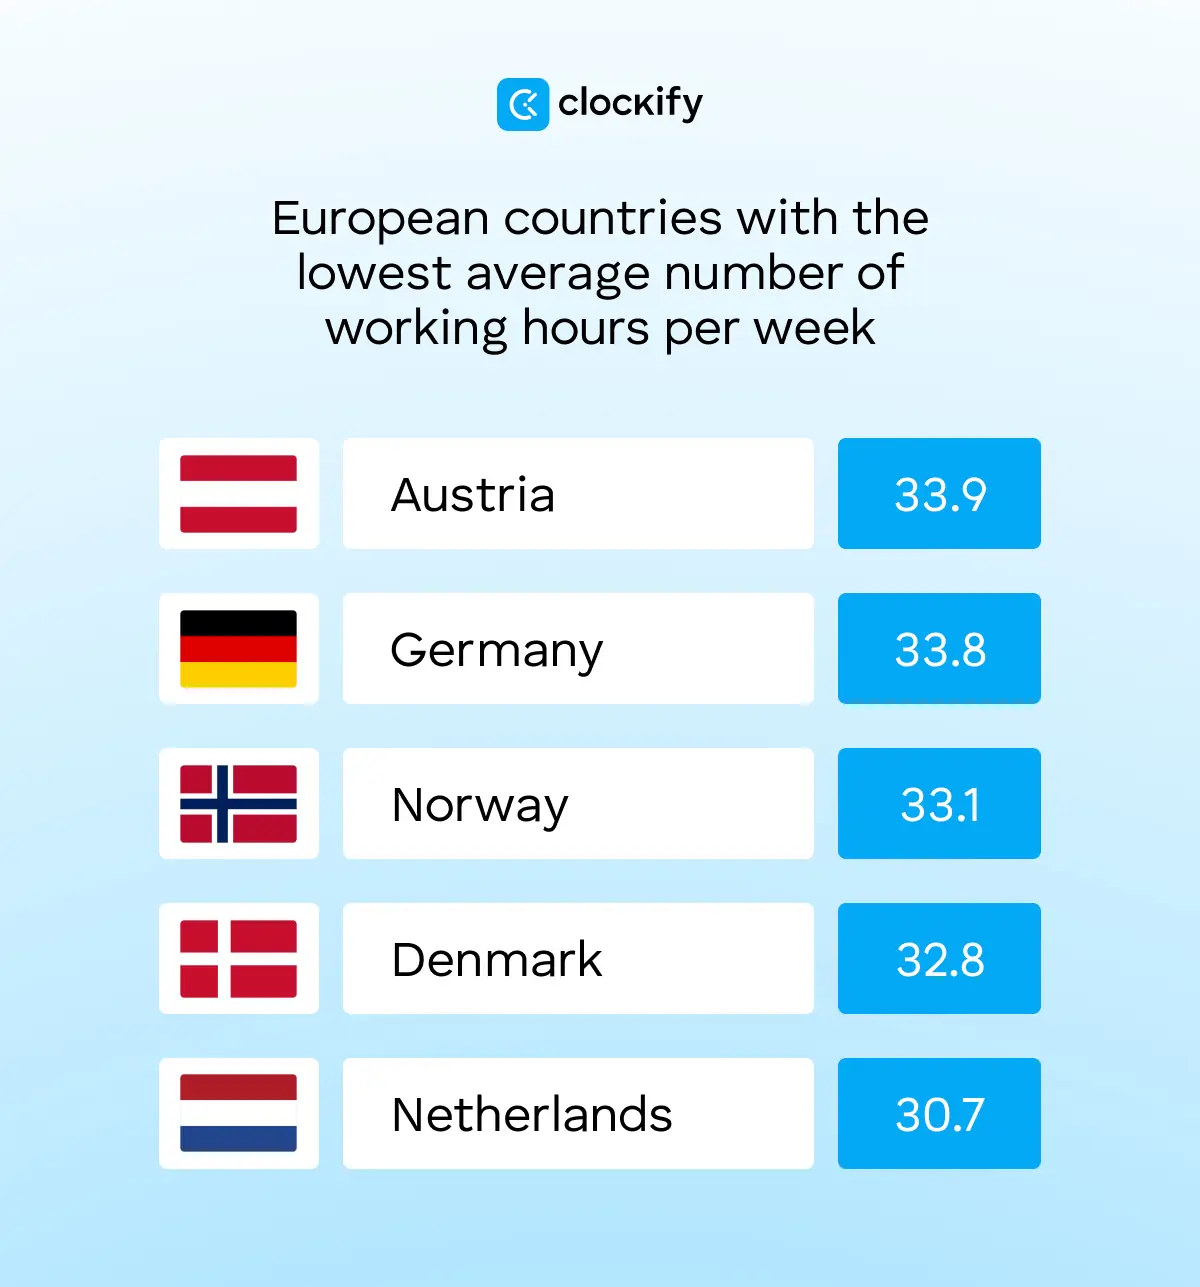
On the other hand, European countries such as Norway, Denmark, and the Netherlands report the lowest weekly working hours. In the Netherlands, many employees have switched to part-time work, which is why their average hours are lower.
🎓 Everything You Should Know about the EU Time Tracking Law
Working hours in Europe — men vs. women breakdown
When it comes to average working hours by gender in Europe in 2025, Türkiye’s full-time employees had the highest number of working hours — 46.8 hours per week for men and 44.0 hours per week for women.
On the other hand, the average number of working hours per week in the European Union was 39.4 for men and 37.6 for women.
|
Top 5 countries with the highest number of working hours — men |
|
|---|---|
| Country | Hours |
| Türkiye | 46.8 |
| Switzerland | 43.4 |
| Serbia | 42.3 |
| Greece | 41.8 |
| Bosnia and Herzegovina | 41.5 |
|
Top 5 countries with the highest number of working hours — women |
|
|---|---|
| Country | Hours |
| Türkiye | 44.0 |
| Switzerland | 42.3 |
| Bosnia and Herzegovina | 41.1 |
| Serbia | 40.8 |
| North Macedonia | 39.3 |
Countries with the fewest working hours are the Netherlands with 35.0 hours for women, and the Netherlands, Norway, and Finland with 38.4 hours for men.
The study by CAKE.com on women in tech reports that 64.98% of women value flexible working hours as the greatest benefit in the workplace. Learn more about this research here ➜
Working hours in Europe — by industry
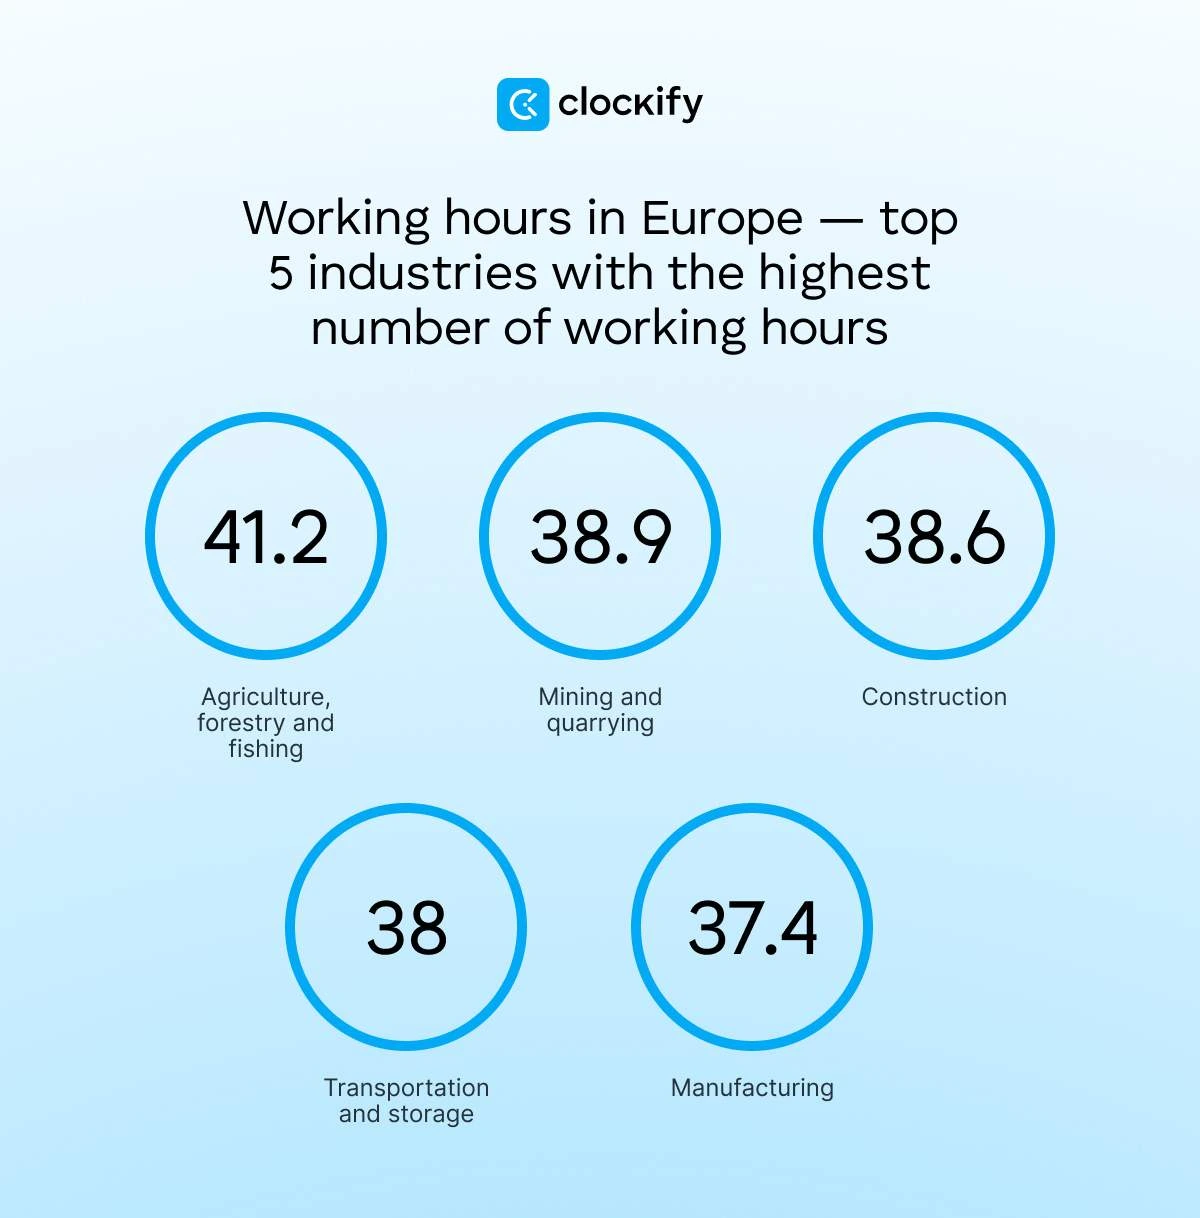
According to the Eurostat research, the top 5 industries with the highest average working hours per week in 2025 were:
- Agriculture, forestry and fishing: 41.2
- Mining and quarrying: 38.9
- Construction: 38.6
- Transportation and storage: 38
- Manufacturing: 37.4
In 2025, the top 5 industries with the lowest average working hours per week were:
- Administrative and support service activities: 33.6
- Human health and social work activities: 33.3
- Arts, entertainment and recreation: 32.7
- Education: 31.8
- Activities of households as employers: 27.1
🎓 How Many Work Days in a Year (2026)
Working hours in Asia
Let’s see average working hours per week in Asian countries — Japan, China, and India.
ILO’s data for 2026 show that the average working hours per week in Japan are:
- 31.10 hours in total
- 33.73 hours — men
- 27.97 hours — women
| Country | Average hours worked per week (total) | Average hours worked per week — men | Average hours worked per week — women |
| Japan | 31.10 | 33.73 | 27.97 |
| China | 44.60 | 44.78 | 44.39 |
| India | 45.69 | 49.69 | 35.60 |
These are the average hours worked per week in China, according to the ILO:
- 44.60 hours in total
- 44.78 hours — men
- 44.39 hours — women
When it comes to India, employees in this country work on average per week:
- 45.69 hours in total
- 49.69 hours — men
- 35.60 hours — women

Paid time off by country
Most countries in the world have laws that set the maximum length of the workweek and the minimum paid vacation, except for the United States. The FLSA doesn’t mandate paid annual leave, such as sick leave, vacations, and federal holidays.
When it comes to countries worldwide, the ILO’s data report these 5 countries as the ones with the highest number of paid vacation per year:
| Country | Legally required paid vacation days per year |
| France | 31 |
| Andorra | 31 |
| Algeria | 30 |
| Burkina Faso | 30 |
| United Arab Emirates | 30 |
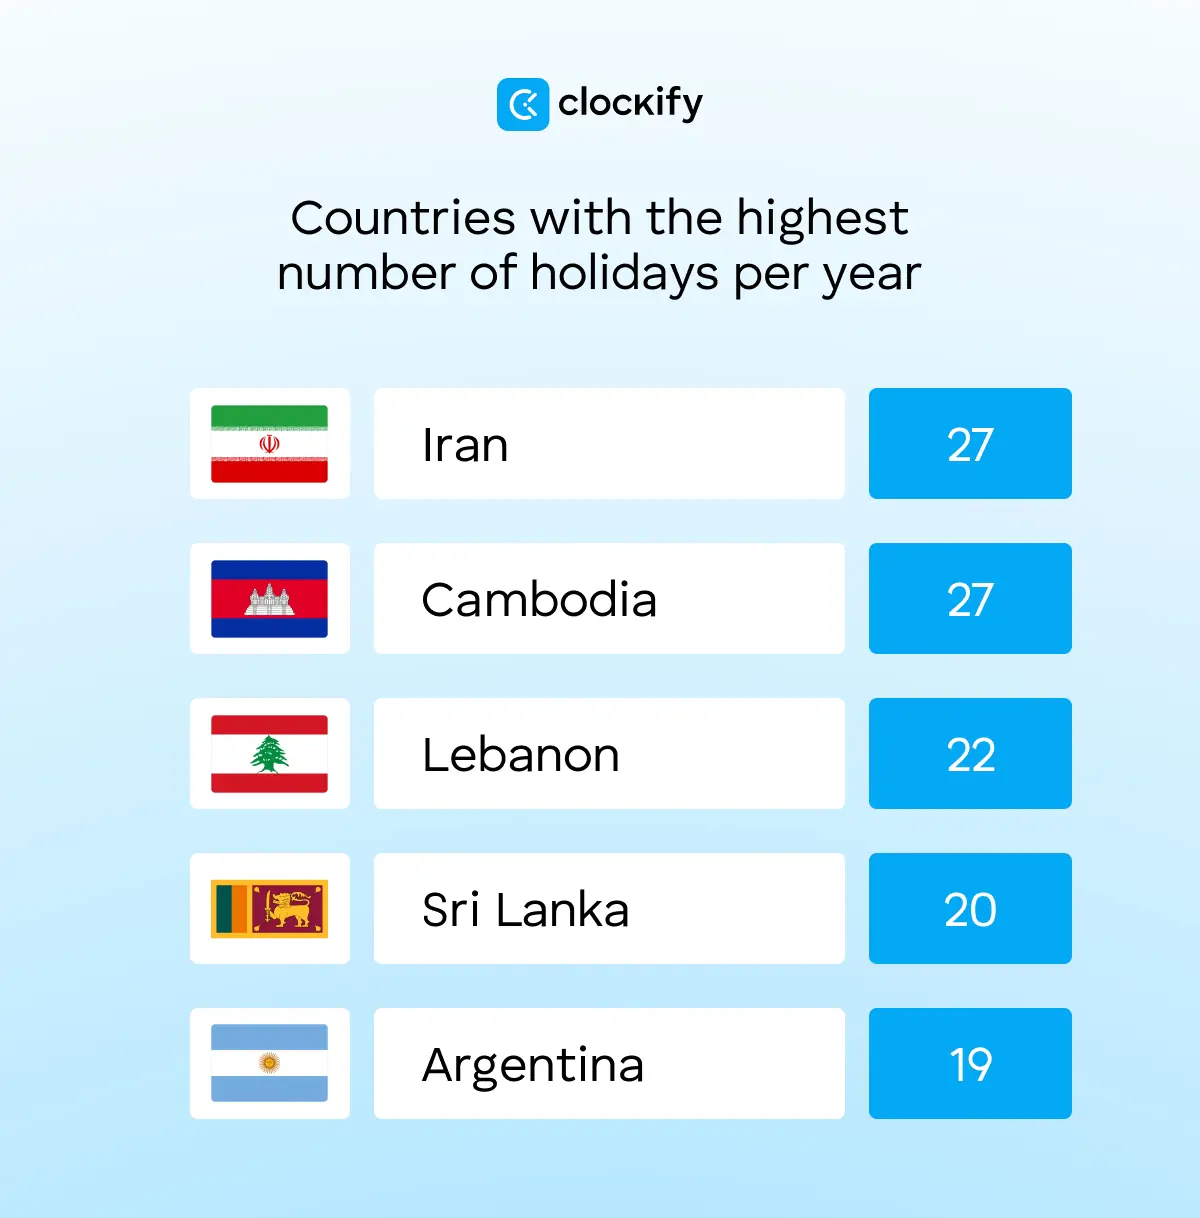
These are the 5 countries worldwide and their number of paid public holidays:
- Iran: 27
- Cambodia: 27
- Lebanon: 22
- Sri Lanka: 20
- Argentina: 19
🎓 What Are Paid Holidays and How Do They Work?
Does working more hours mean higher productivity?
No, a longer working week doesn’t necessarily result in higher levels of productivity.
Apart from hours worked, it’s important to analyze the country’s GDP per capita — a metric calculated by dividing the country’s GDP by its population. Another metric is GDP per hour worked, calculated by dividing overall GDP by total hours worked.
Developed countries usually have high GDP per capita and GDP per hour worked. For example, employees in Ireland and Luxembourg work between 34 and 35 hours per week on average. But ILO’s labor productivity statistics show that their GDP per hour is the highest in the world ($164.7 and $159.5, respectively).
On the other hand, workers in Lesotho have quite long weekly shifts (49.98 hr per week), but their GDP per hour is among the lowest ($3.3).
| Country | Highest GDP per hour worked in 2025 |
| Ireland | $164.7 |
| Luxembourg | $159.5 |
| Channel Islands | $146.0 |
| Norway | $125.6 |
| Singapore | $100.4 |
4-day workweek by country
The following list shows countries worldwide that have tested a 4-day workweek:
| Countries that trialed a 4-day workweek | Details |
| United States | • Started in 2022 • 6-month trial across the US and Canada |
| Brazil | • Started in September 2023 • 9-month trial |
| Japan | • In 2021, the Japanese government recommended a 4-day workweek |
| Germany | • Started in 2024 • 6-month trial |
| United Kingdom | • Started in 2022 • 6-month trial |
| France | • Started in 2024 • National pilot program |
| South Africa | • Started in 2023 • Without pay cuts |
| Spain | • Started in 2021 • 3-year trial |
| Canada | • Started in 2022 • 6-month program, together with the US |
| Australia | • From 2022 to 2023 • A pilot program included Australia and New Zealand |
| Netherlands | • The shortest average workweek in the world (29 hr) |
| Belgium | • Started in 2022
• Follows a 4/10 plan (4 days a week, 10-hour shifts) |
| United Arab Emirates | • Started in 2022 • First introduced for government employees |
| Sweden | • Started in 2024 |
| Portugal | • Started in 2023 • 6-month trial |
| Austria | • Started in 2024 |
| Switzerland | • Started in 2024 • 6-month trial |
| Denmark | • Started in 2024 |
| Norway | • Started in 2024 • 6-month trial |
| Ireland | • Started in 2022 • 6-month trial |
| New Zealand | • A pilot program from 2022 to 2023, with Australia |
| Iceland | • A pilot program from 2015 to 2019 |
| Scotland | • Only in the public sector • A pilot program lasted from 2023 to 2025, without pay cuts |
Apart from the ones above, some countries have adopted specific rules about a 4-day workweek. For example, in Lithuania, working parents in the public sector who have children under 3 years old are permitted to work 32 hours per week without pay reductions.
🎓 Everything You Need To Know About the 4-Day Work Week Concept
For our expert contributor, Babak Hafezi, fewer working hours aren’t luxuries, but rather a practical model that can increase employment:
“For example, France moved to a 36-hour workweek, not to provide greater luxury for its citizens but rather to create more jobs. Thus, the genesis of reduced working hours is driven by a need to increase employment rather than to provide luxuries for its citizens.”
Hafezi adds another example that proves this claim: “During the Asian financial crisis, some companies in Singapore moved to staggered part-time employment for all their workforce, with 2 weeks on, 2 weeks off, to keep the know-how in-house and to ensure that the company would retain talent, rather than firing a large portion of their employees as a means to keep their core competitive advantage.”
Manage time and PTO effectively with Clockify by CAKE.com
Even though working hours vary across countries, they’ve decreased since the 19th century. Compared with the average 1870s worker, who worked more than 3,000 hours per year, a 2020 employee worked between 1,314 and 2,599 hours.
Simple tools like Clockify by CAKE.com allow you to track work hours in several ways:
- Timer
- Timesheet
- Auto tracker
- Kiosk
Clockify works on mobile, desktop, and browsers, so no matter the platform you choose, all your time tracking data will be synced.
If you want your employees to always include vital information about their tasks, such as a description, project, or tag, you can set these fields as required.

Apart from tracking hours, Clockify lets you manage paid time off and create time-off policies. Once you set up a time-off policy in Clockify, you’ll have an overview of each employee’s balance.
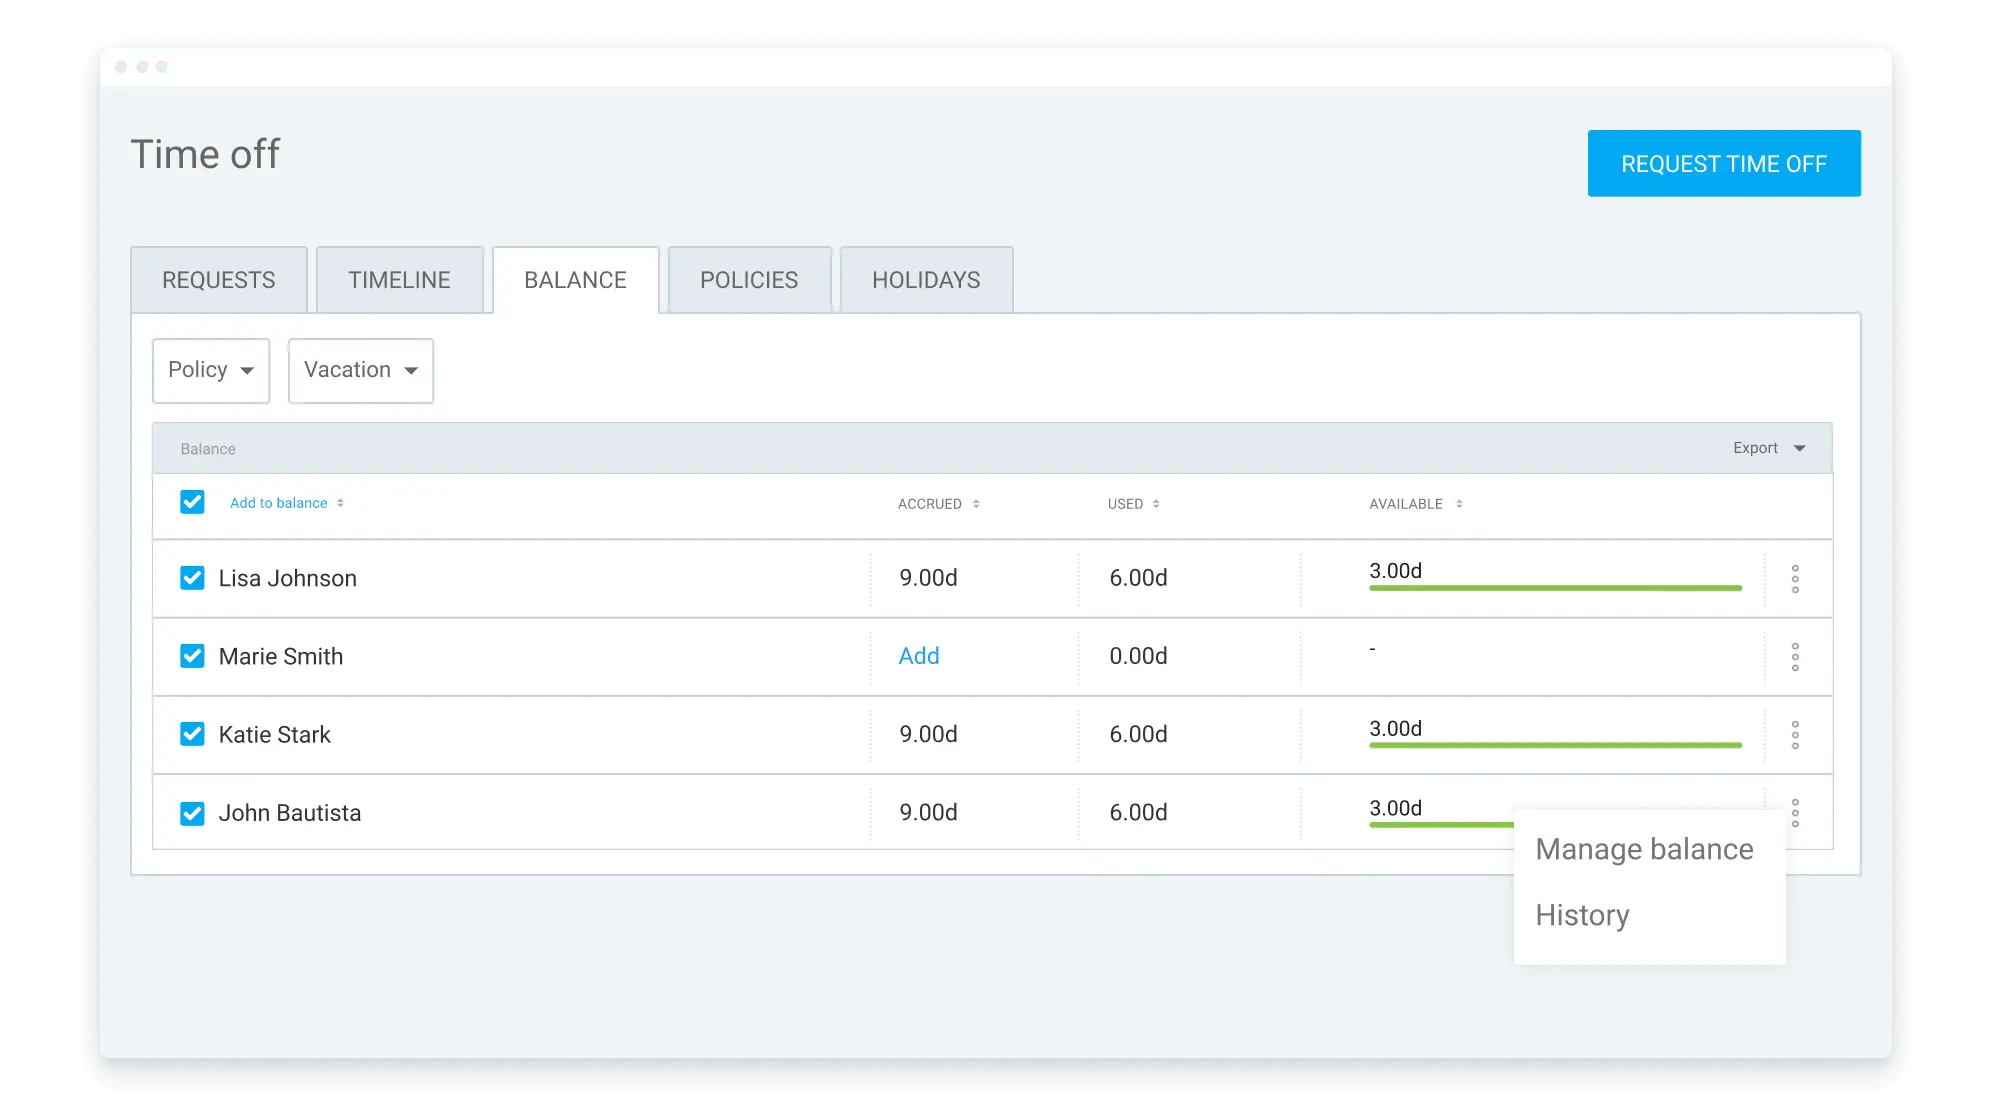
Clockify’s Time off feature lets you set start and end dates for your time-off balance. But the balance expiry date is optional in Clockify, so it’s up to you as a manager or business owner whether you want to use it.
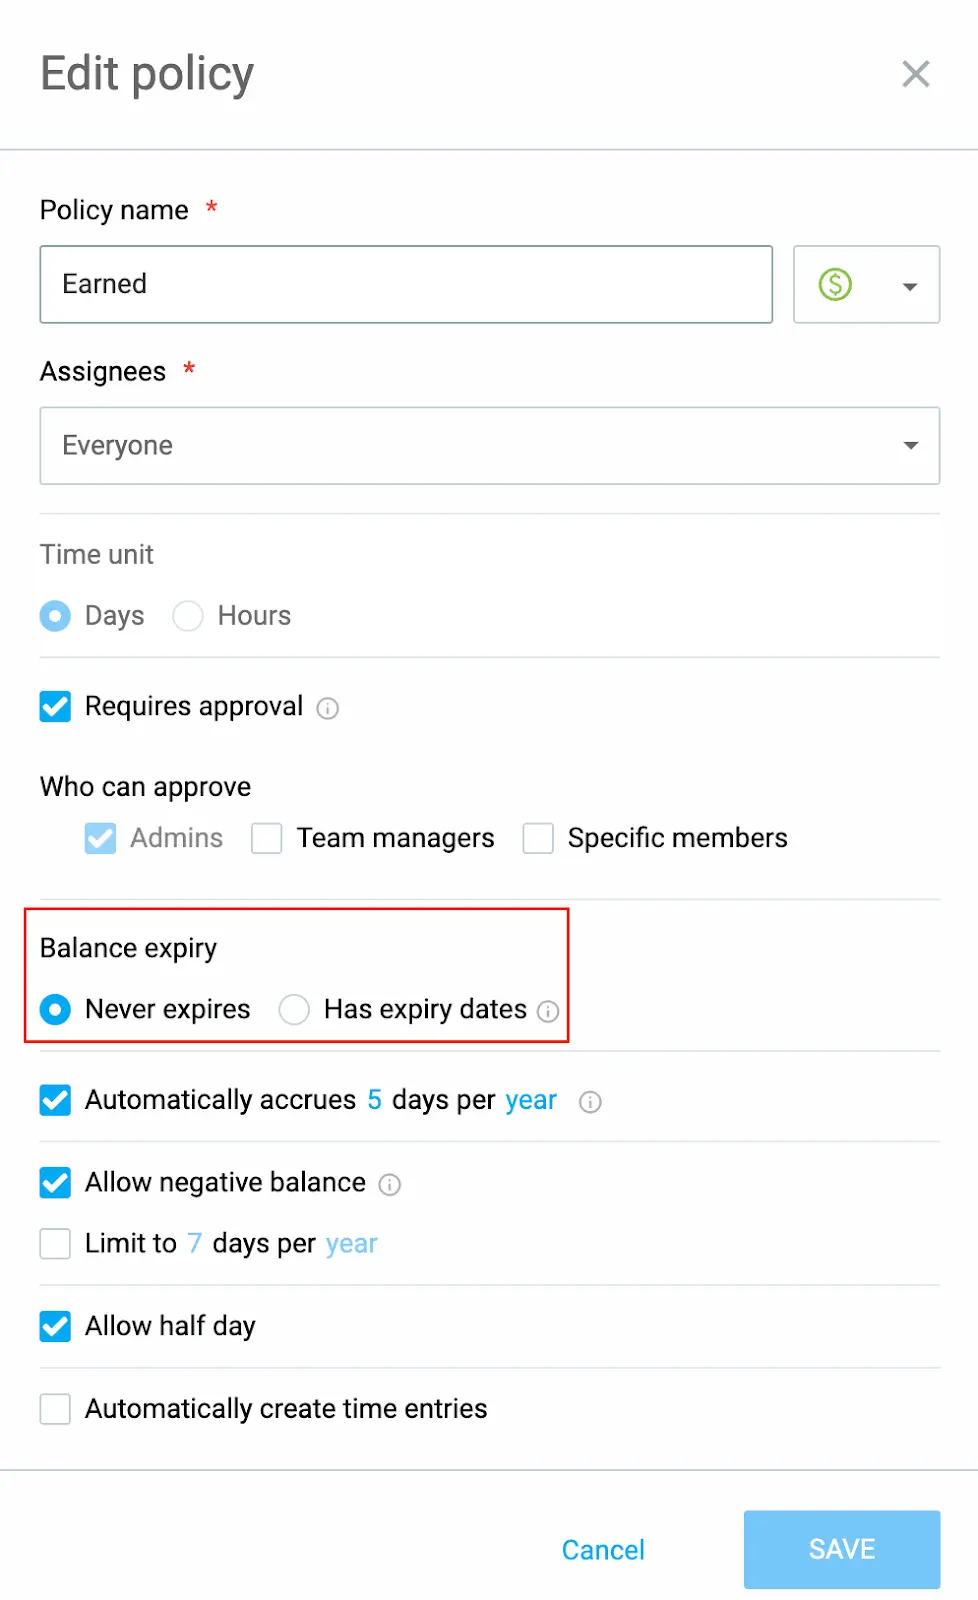
Another practical option with Clockify’s time-off policies is the ability to allow half-day time-off and negative balances, and to decide whether employee requests must be approved by managers.
Finally, all Clockify users have access to 24/7 human customer support, even on the Free plan.

FAQs about work hours
If you’re looking for more information about work hours, check out the following section.
Which country has the highest average working hours?
The International Labour Organization reports that Bhutan has the highest average working hours — 54.68 hours per week in 2026.
What country has the least working hours?
The country with the lowest average working hours is Yemen, with 22.95 hours per week in 2026, according to the ILO.
Does the US work more hours than other countries?
Compared with the OECD average of 1,736 hours, the US has lower hours — 1,721 hours in 2025. If you compare the US with Germany, the US has more annual working hours on average, since Germany has 1,332 per year.
Is working 50 hours a week a lot?
Even if it’s compensated, working 50 hours a week can cause fatigue, lower productivity and alertness, and sometimes even health problems, according to the Occupational Safety and Health Administration (OSHA).
The FLSA doesn’t regulate the number of hours an employer can require employees to work. However, pay is regulated, with any hours over 40 hours a week considered overtime.
🎓 Working Overtime Without Pay – Know Your Rights and Options | Mandatory Overtime: What You Need to Know
Is a normal workday 8–5 or 9–5?
The only difference between an 8–5 and a 9–5 workday is that under an 8-to-5 work schedule, employees have an hour-long unpaid lunch break. In the end, the choice between the two lies with the employer and workplace policies.
🎓 What Is the DDNNOO Work Schedule and How To Implement It? | The DuPont Schedule — What Is It and Why Should You Use It? | Use the 2-2-3 Work Schedule To Enhance Productivity Instantly
Is working 80 hours a week illegal?
FLSA doesn’t regulate the number of hours worked, so if you agree to work 80 hours a week, it’s legal to do so. That’s not the case everywhere in the world, though. For example, in the UK, you can’t work more than 48 hours a week.
What is the 996 schedule in China?
The 996 schedule is one many companies in China follow, with employees working from 9 a.m. to 9 p.m., 6 days a week.
Jack Ma, founder of Alibaba, advocated for this schedule. On the other hand, for many experts, this schedule is a form of modern slavery.
Which country is No. 1 for salary?
The No. 1 country for salary is Switzerland with an average salary of $131,416, according to the CEO World Magazine report. Switzerland is followed by Luxembourg and the United States.