

Alex Beadon
Founder of Together We Launch
"We use Clockify to see where our time is going and how to solve any problems. It’s just so beneficial."
More stories

Find new apps that fit you team's needs
At work, wasted time creates serious financial bottlenecks. In personal life, wasted time manifests as dissatisfaction and regret. All of those can be prevented.
In this article, we explore the most insightful time tracking statistics. Identify the biggest improvement areas, from work hours and overtime to watching TV and doing sports.

According to data compiled by Clockify, here’s how people tracked their time at work in 2025:
This data shows clear room for improvement in accurate timekeeping. According to Barry Farah, CEO of a Phoenix-based HVAC company and our expert contributor:

“Accurate leave and holiday tracking matters because people’s lives are not ’nonproductive time’. The obvious wins are cleaner payroll and fair scheduling. The deeper win is trust, because a team that sees its time respected is far more likely to respect the customer’s time.”
The easiest way to implement successful process changes is by tracking time with a work hours tracker like Clockify by CAKE.com. You can track hours, breaks, and PTO to estimate underbilled revenue, justify necessary policy changes, and eliminate manual spreadsheet mistakes.
This section shows how people spend their non-work hours.
According to the 2026 Your Life in Numbers study, a person with an average lifespan of 79 years spends multiple years on repetitive, everyday activities.
| Activity | Average time spent in a lifetime |
| Sleep | 26 years |
| Time at work | 13 years (out of an average working period of 50 years) |
| Watching TV | 8 years and 4 months |
| Trying to fall asleep | 7 years |
| Eating | 4.5 years |
| Social media | 3 years |
| Holidays | 3 years |
| Working overtime | ~1.4 years |
| Exercising | 1.3 years |
| Primary and secondary school | almost 1 year (334 days) |
| Waiting in queues | 235 days |
The study shows that we spend most of our time sleeping, followed by time spent at work. However, the most worrying statistic is the 8 years and 4 months spent watching TV, despite it being associated with an increased risk of brain-based disorders.
Apart from traditional TV, people worldwide spend a lot of time streaming TV shows and movies. According to Netflix’s 2026 report, members worldwide streamed 97 billion hours of content in the first half of the year.
These statistics reveal that we spend much more time on distractions than on beneficial activities like exercising or socializing.
Here’s how Americans spend their time on a typical day, according to the BLS 2026 American Time survey:
| Activity | Average time spent per day |
| Sleeping | 9 hours and 1 minute |
| Work and work-related activities | 3 hours and 25 minutes* |
| Watching television | 2 hours and 36 minutes |
| Eating and drinking | 1 hour and 12 minutes |
| Food preparation and cleaning up afterward | 42 minutes |
| Socialization and communication | 34 minutes |
| Housework | 33 minutes |
| Helping other household members | 29 minutes |
| Educational activities | 26 minutes |
| Childcare | 21 minutes |
| Buying consumer goods | 18 minutes |
| Sports, exercising, and recreation | 20 minutes |
| Caring for the lawn and garden | 11 minutes |
| Helping and caring for non-household members | 31 minutes |
| Telephone calls, emails, and regular mail | 12 minutes |
| Managing the household | 9 minutes |
| Volunteering | 7 minutes |
| Other activities | 16 minutes |
*Although some activities may seem too low or too high, they represent daily annual averages and include relevant travel time. Many activities are not done daily, and some are done only by a subset of the population.
All values were converted from decimal hours to hours and minutes using Clockify’s Decimal hours converter.
Now, let’s examine other prominent sections of a typical day for US citizens.
BLS time use statistics in 2025 show that Americans were less likely to socialize and communicate today than in 2015. In 2015, people spent around 41 minutes per day on these activities. In 2025, that figure fell to an average of 35 minutes per day.
The survey also has these interesting insights into free time distribution based on age:
Surprisingly, Americans spent an average of only 1 minute per day on purchasing personal care services (day spas, hair salons, barbershops, etc.) and professional care services (financial, legal, medical, adult care, or real estate services, etc.).
🎓 The 2024 Gender Inequality in Unpaid Domestic Work Report
Keeping accurate employee work hours is vital for billing clients accurately and complying with DCAA Timekeeping requirements. Here’s how people spend their time at work globally and in the US, according to tracked data.
According to the OECD work time data for 2025, these are the top 5 countries with the highest number of hours worked per year:
Take a look at the full country list below:
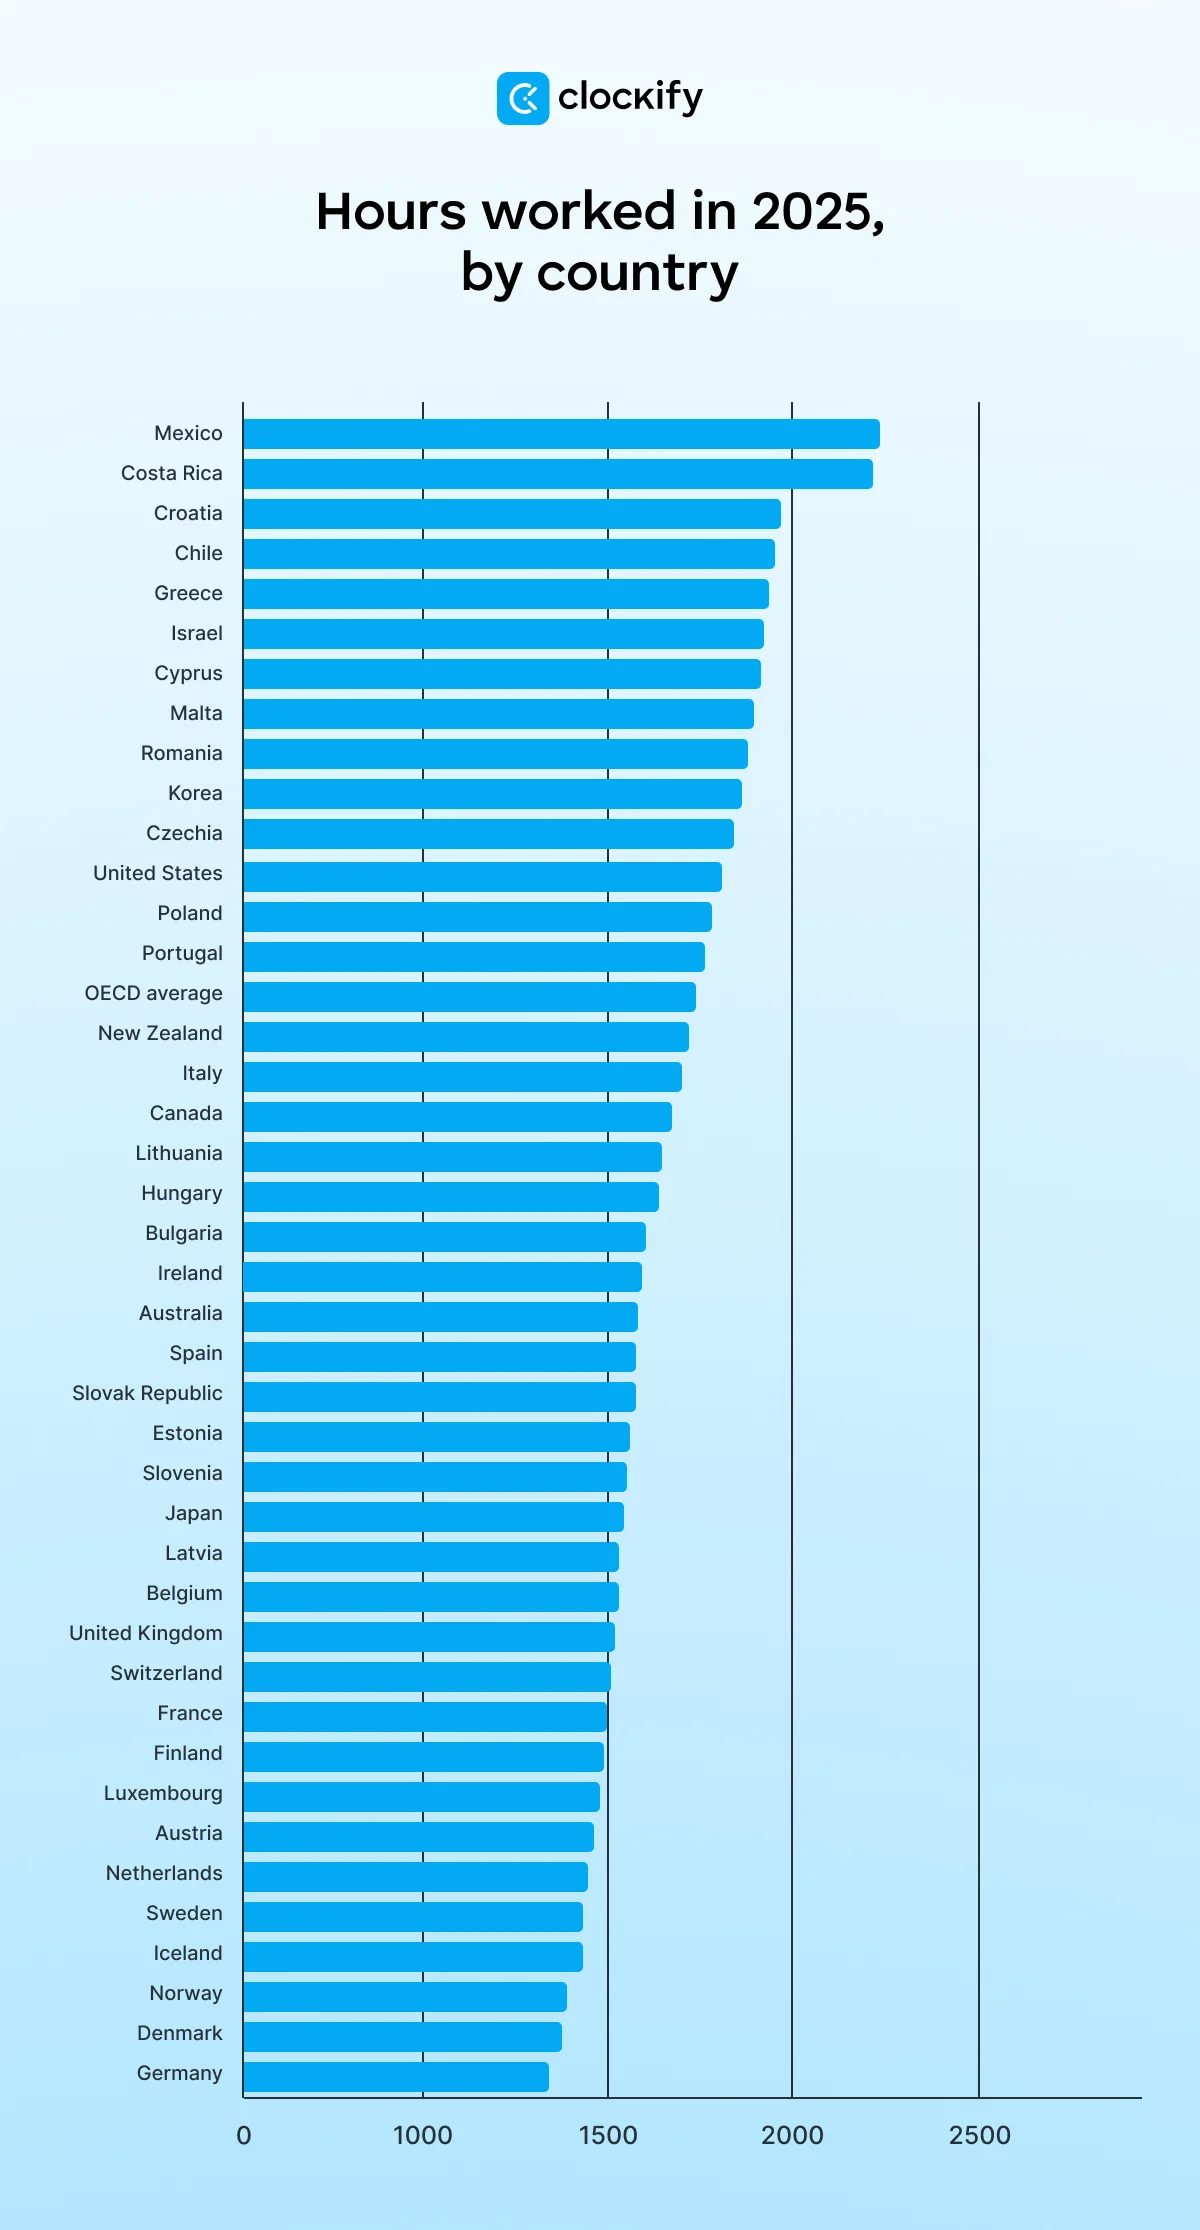
The same research states that the top 5 countries with the lowest number of annual hours worked are:
The time between Germany (the lowest) and Mexico (the highest on the list) varies by 800+ hours, implying major differences in weekly free time. The average weekly worktime is 27.7 hours in Germany and 45.9 in Mexico.
According to the BLS report above, Americans spent an average of 3 hours and 1 minute per day on work and work-related activities. However, full-time employed people worked an average of 8.1 hours.
When it comes to time of the week spent working, US citizens spent an average of:
Workers aged 25 and over with higher levels of education were much more likely to work at home than those with lower education:
The BLS report also included data on work hours across different employment types on an average day.
| Employment type | Daily work hours |
| Full-time employees | 8 hours and 42 minutes |
| Part-time employees | 5 hours and 21 minutes |
| Workers with one job | 7 hours and 37 minutes |
| Workers with multiple jobs | 7 hours and 58 minutes |
🎓 Part-time vs. Full-time Employment: Understanding the Difference
The same report also shows how many hours US citizens work on an average day, based on occupation.
| Employee occupation | Daily work hours |
| Management, business, and finance workers | 7 hours and 23 minutes |
| Professional service workers | 7 hours and 23 minutes |
| Sales and related | 7 hours and 26 minutes |
| Administrative support | 7 hours and 52 minutes |
| Forestry, farming, and fishing | 7 hours and 17 minutes |
| Construction and extraction | 7 hours and 55 minutes |
| Installation, repair, and maintenance | 8 hours and 35 minutes |
| Production | 8 hours and 15 minutes |
| Transportation and material-moving industry | 7 hours and 59 minutes |
Most of the listed occupations show a slight increase compared to last year’s report.

US citizens spend more time performing billable tasks (tasks that generate direct profit) than non-billable tasks (administrative tasks, business development, internal projects).
According to Clockify data from 2,300 US companies, the billability status of work hours is as follows:
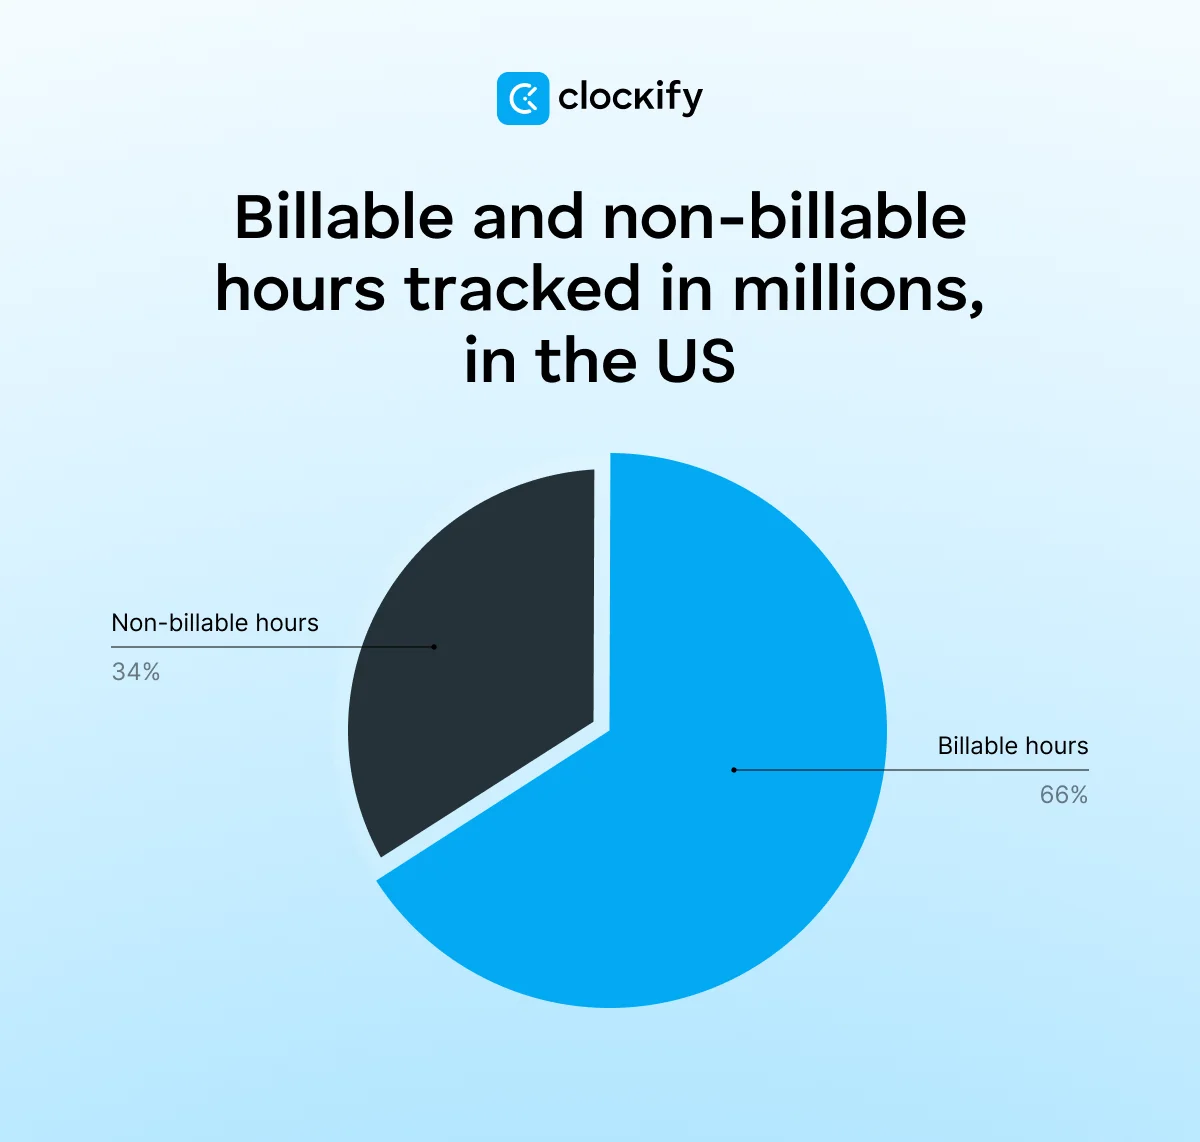
However, maximizing billable hours isn’t a shortcut to business success. Both types of tasks are crucial for steady growth and effective resource utilization.
Our expert contributor, Ohio-based Certified Public Accountant Joshua Katz, states that a 65-75% billable-hours range is optimal:

“If billable hours are lower than 60%, you're losing money. If they’re more than 80%, you are on a road to burnout because no one is doing the administrative, business development, or training that keeps the lights on long-term.”
Joshua says he saw companies that tried to achieve 85% and lost their most valuable employees in 2 years.

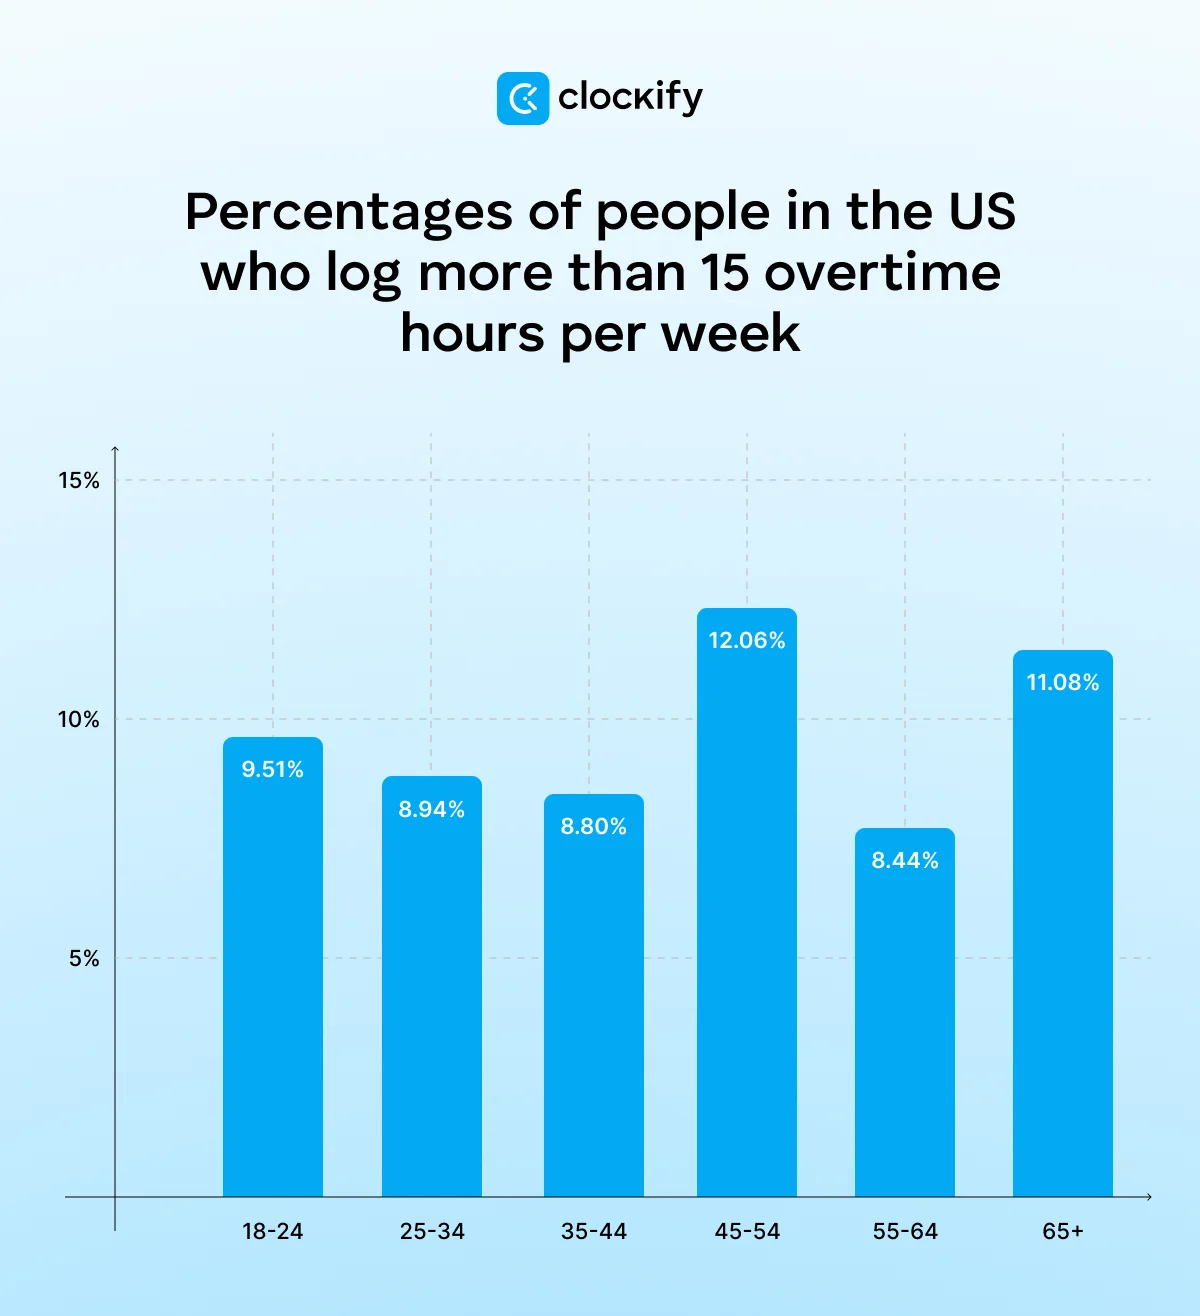
According to State of Workplace Culture and Work-Life Balance Trends by CAKE.com, different generations have diverse habits and attitudes towards working overtime. For example, 12% of US participants aged 45-54 logged more than 15 hours of overtime per week.
Here’s how all of the 8,800 participants in the study responded to logging more than 15 hours of weekly overtime:
However, the same study also shows that many participants worldwide don’t log more than 40 hours per week. These are the percentages for worldwide data:
In the US only, 53% of respondents aged 18 to 24 reported not logging any overtime hours. Here are the details for other generations in the US:
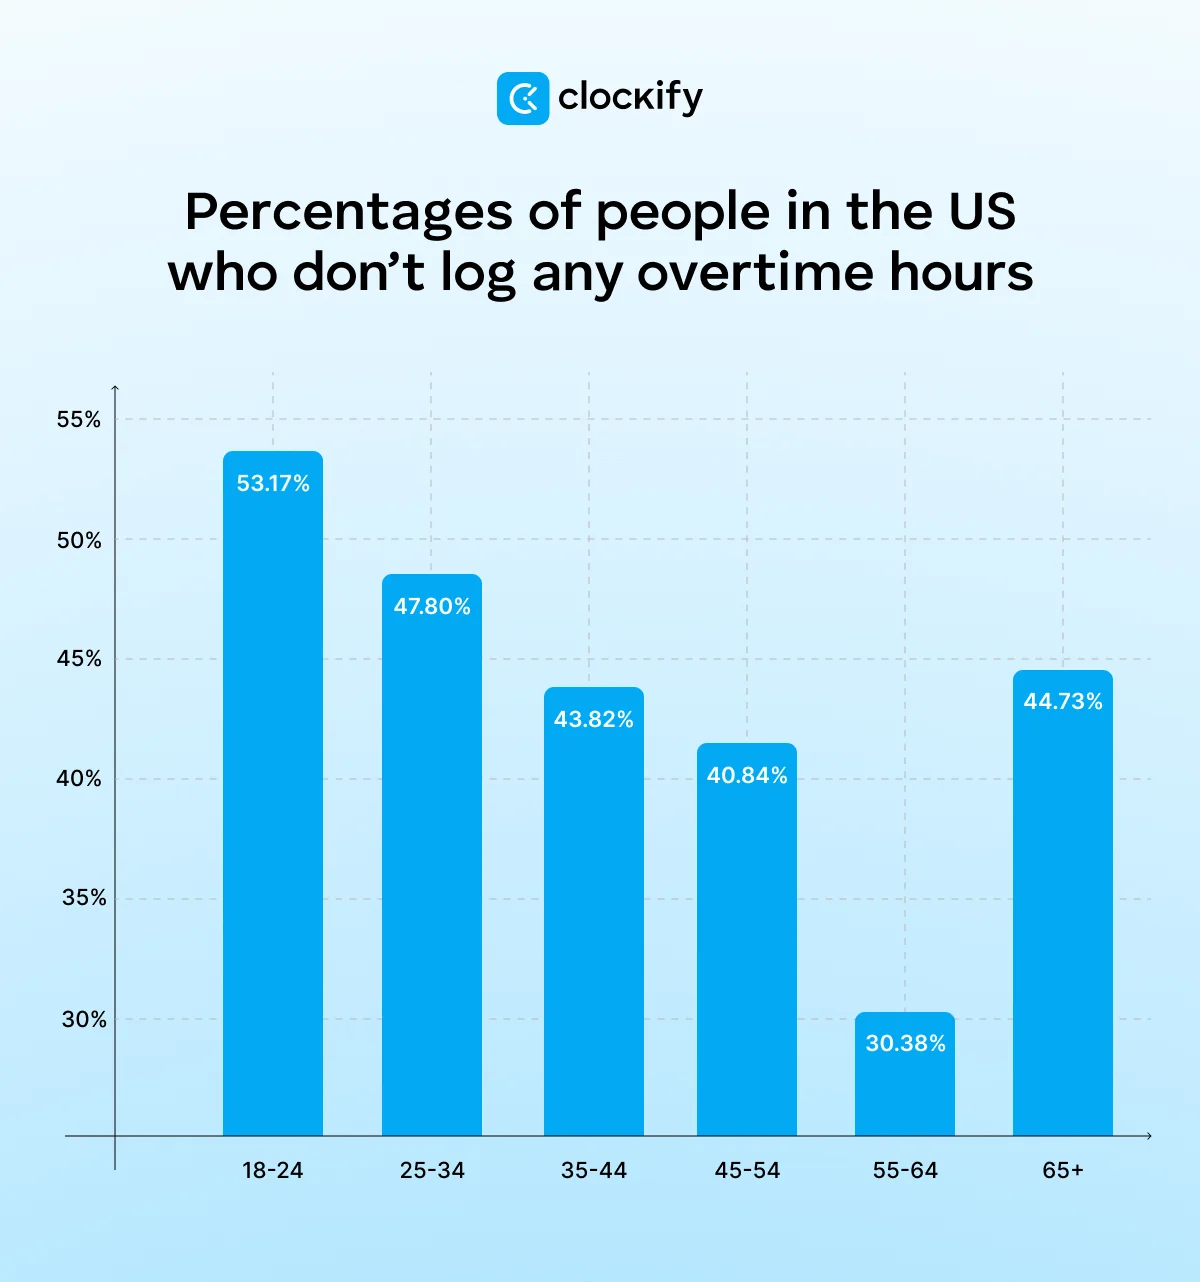
Finally, the study’s Gen Z participants (aged 18-24) were much more likely to avoid working overtime than respondents aged 55-64.
According to Email Marketing Statistics for 2026, here’s how much time respondents allocate to emails on an average day:
For virtual meetings, technical difficulties are one of the biggest bottlenecks. In fact, 77% of people report losing time in meetings because of technical difficulties, according to Pumble’s communication statistics for 2026.
To counter this, you can keep accurate time with a tool like Clockify to visualize time spent on meetings. This will give you a better clue of whether you can eliminate some unnecessary team sessions.
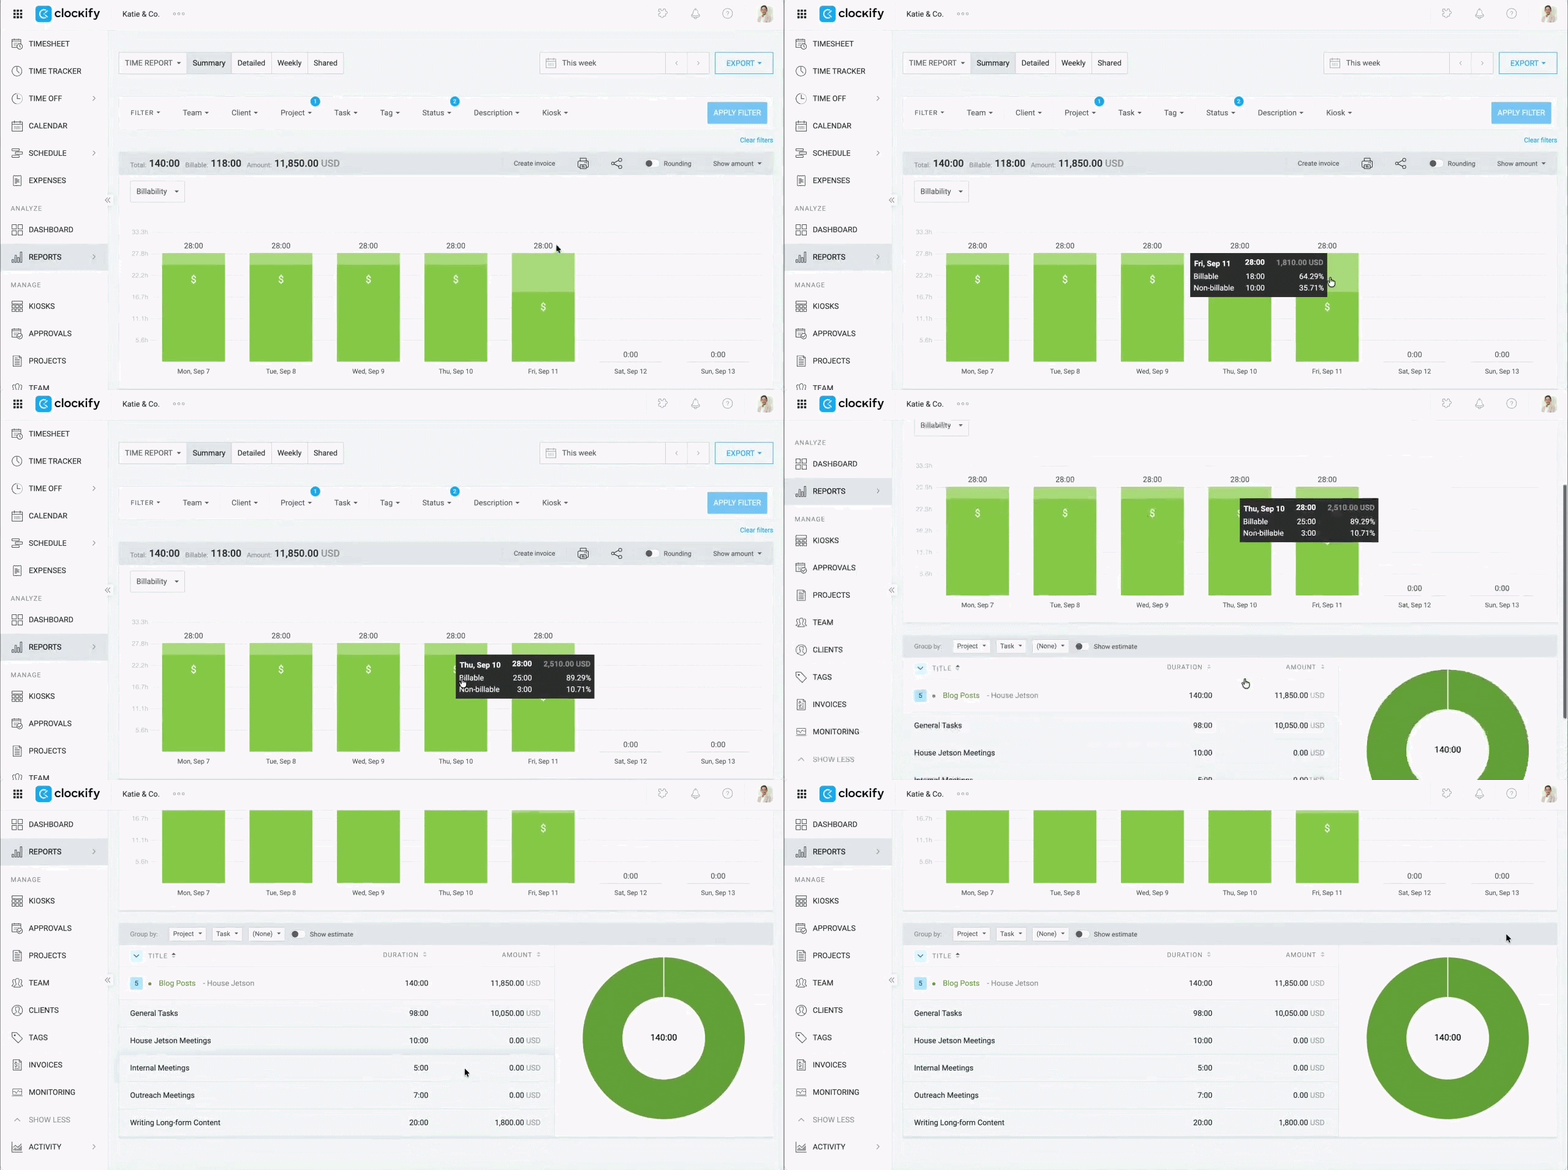
Surprisingly, Clockify’s data suggests that only 5% of US companies utilize a dedicated breaks feature to record breaks within their teams.
According to the same data, 95% of business leaders, team leaders, and project managers aren’t using a dedicated breaks feature. However, some companies create projects in their time tracker called “Breaks” to record break time.
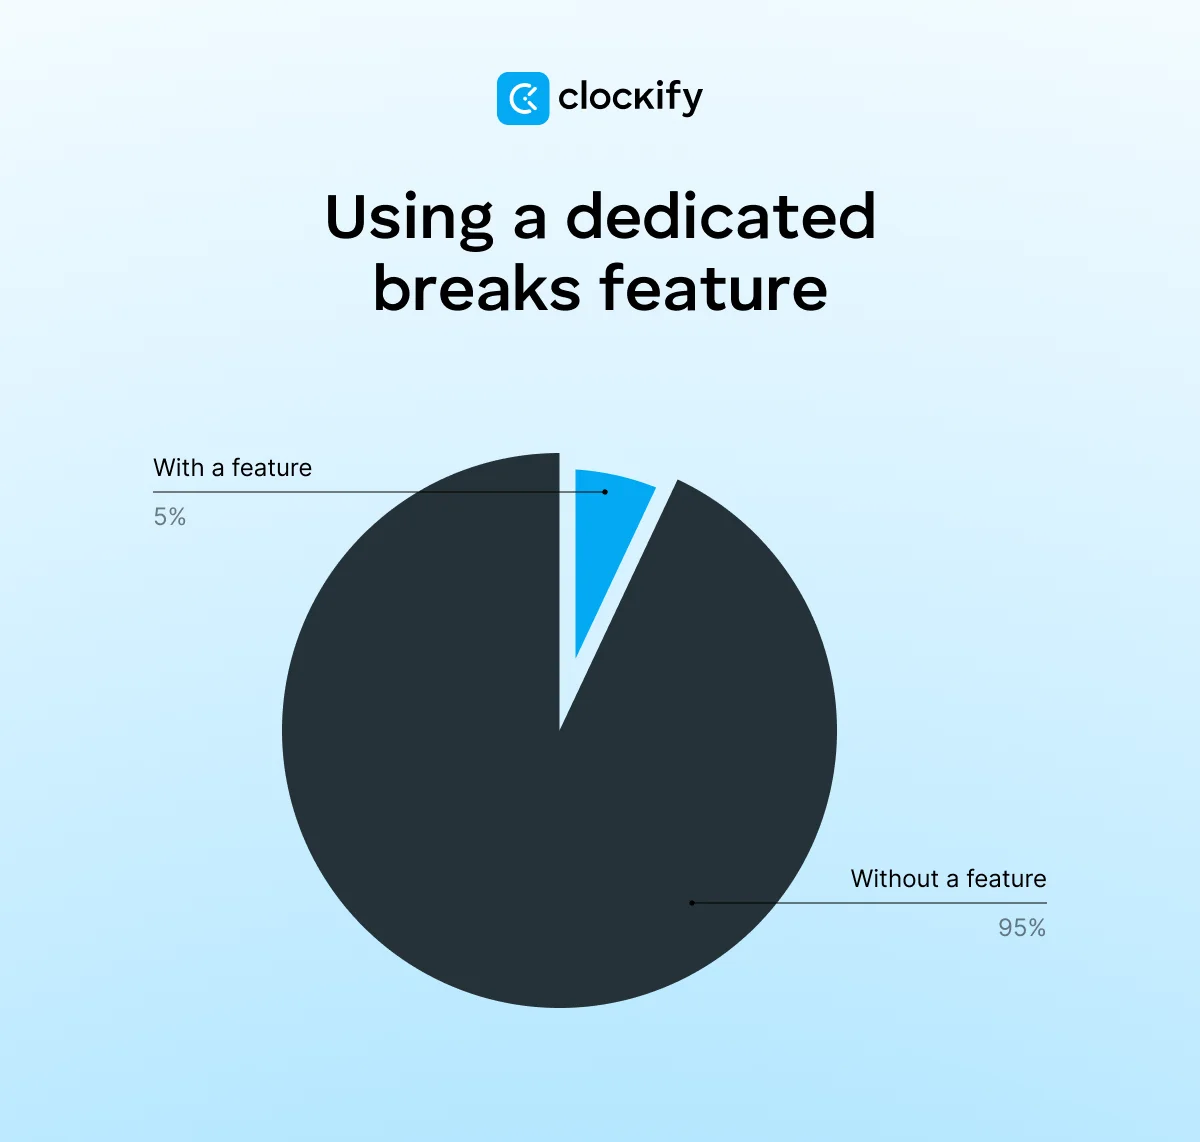
Beyond breaks, our research also analyzed whether US businesses log time off and holidays. These are the results for time off:
🎓 Average PTO in the USA: 2026 Statistics and Trends
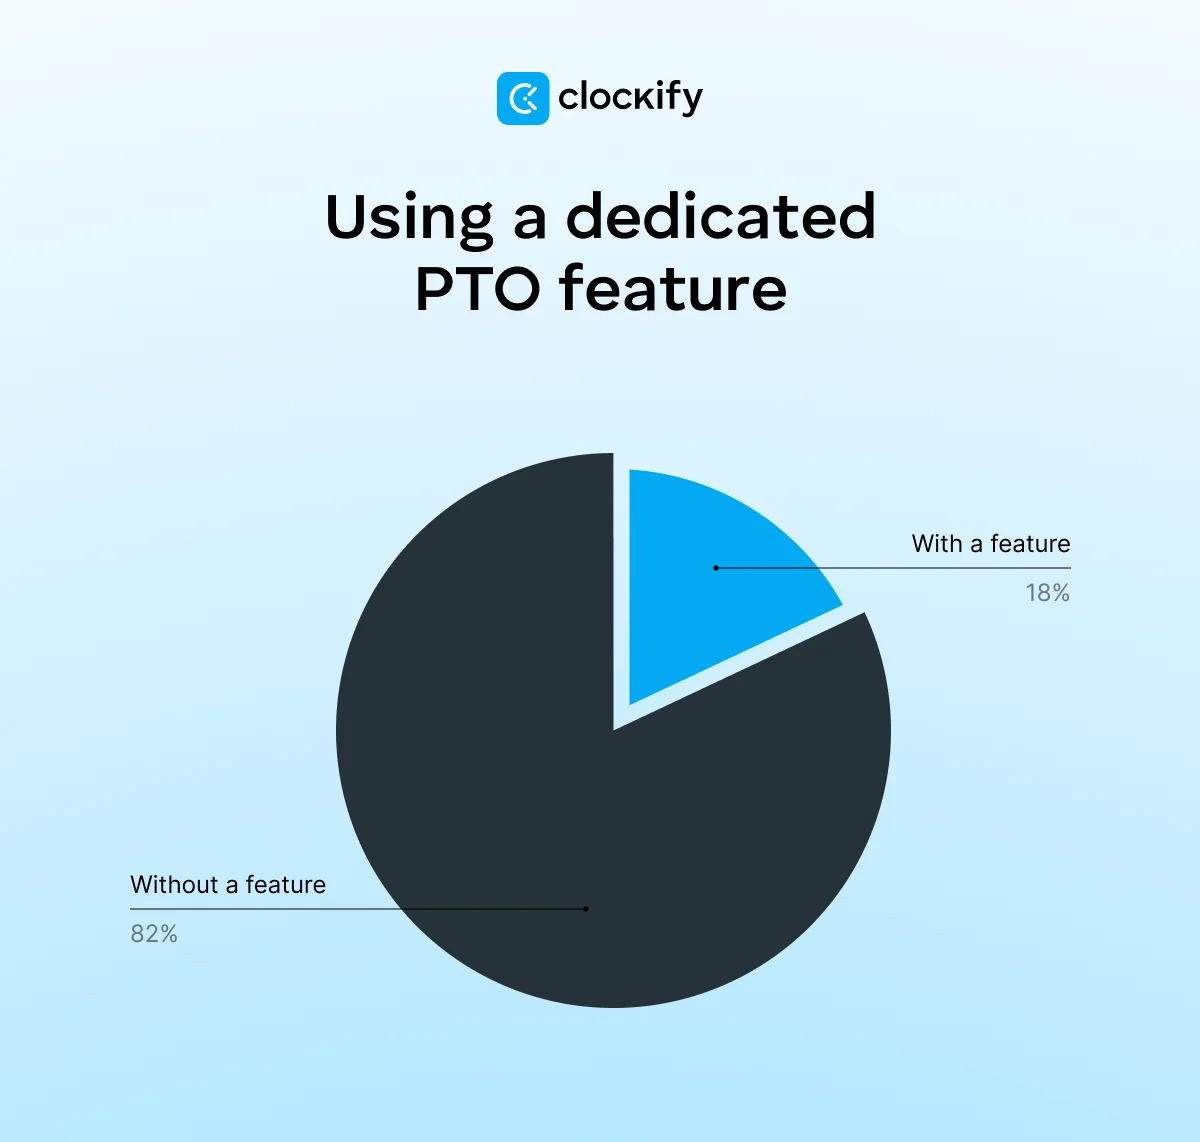
When it comes to holidays, only 17% of US companies track their holidays. The remaining 83% of businesses either record their holidays as part of their general PTO or don’t track holidays with their time tracking software.
This makes time tracking cluttered, inefficient, and error-prone. A centralized time tracking solution like Clockify solves this issue by keeping work hours and employee leave hours under one roof.
Employees get distracted at work all the time, but it’s difficult to identify their biggest time sinks. Let’s review some employee productivity statistics on the biggest time wasters at work.
According to Microsoft’s 2026 data, 57% of employee time goes strictly to communication platforms (email, chat, and meetings). This leaves only a small part of their day for actual creation or deep work.
Likewise, 68% of employees from the same article report not having enough uninterrupted focus time during the workday.
In the same Microsoft report, employees rank “inefficient meetings” as the main threat to their productivity.
Here’s how the survey’s respondents feel about their workplace meetings:
Finally, one of the biggest time-wasting culprits is poor organization in general. According to Potential Project’s recent article (powered by Harvard Business Review’s data), 65% of respondents fail to complete their tasks.
Harvard Business Review’s data lists the following as the biggest workplace distractions:
Interestingly, 96% of leaders surveyed said that enhanced focus would be “extremely valuable” for them. Thankfully, time trackers can help you get there sooner.
🎓 Effects of Workplace Distractions: 2025 Statistics
Dedicated time tracking software is the best solution to prevent time sinks at work.
Clockify by CAKE.com is a time tracking software that lets you keep track of work hours, employee leave, and expenses, and generates advanced reports and client invoices.
Here’s how to make the most of Clockify to quickly improve your team’s productivity:
#1: Track time
You can track time in Clockify using:
Tracked time automatically feeds into Clockify features like Invoices and Reports — eliminating the need for manual calculations. Just apply relevant filters to convert individual or group hours into invoices.
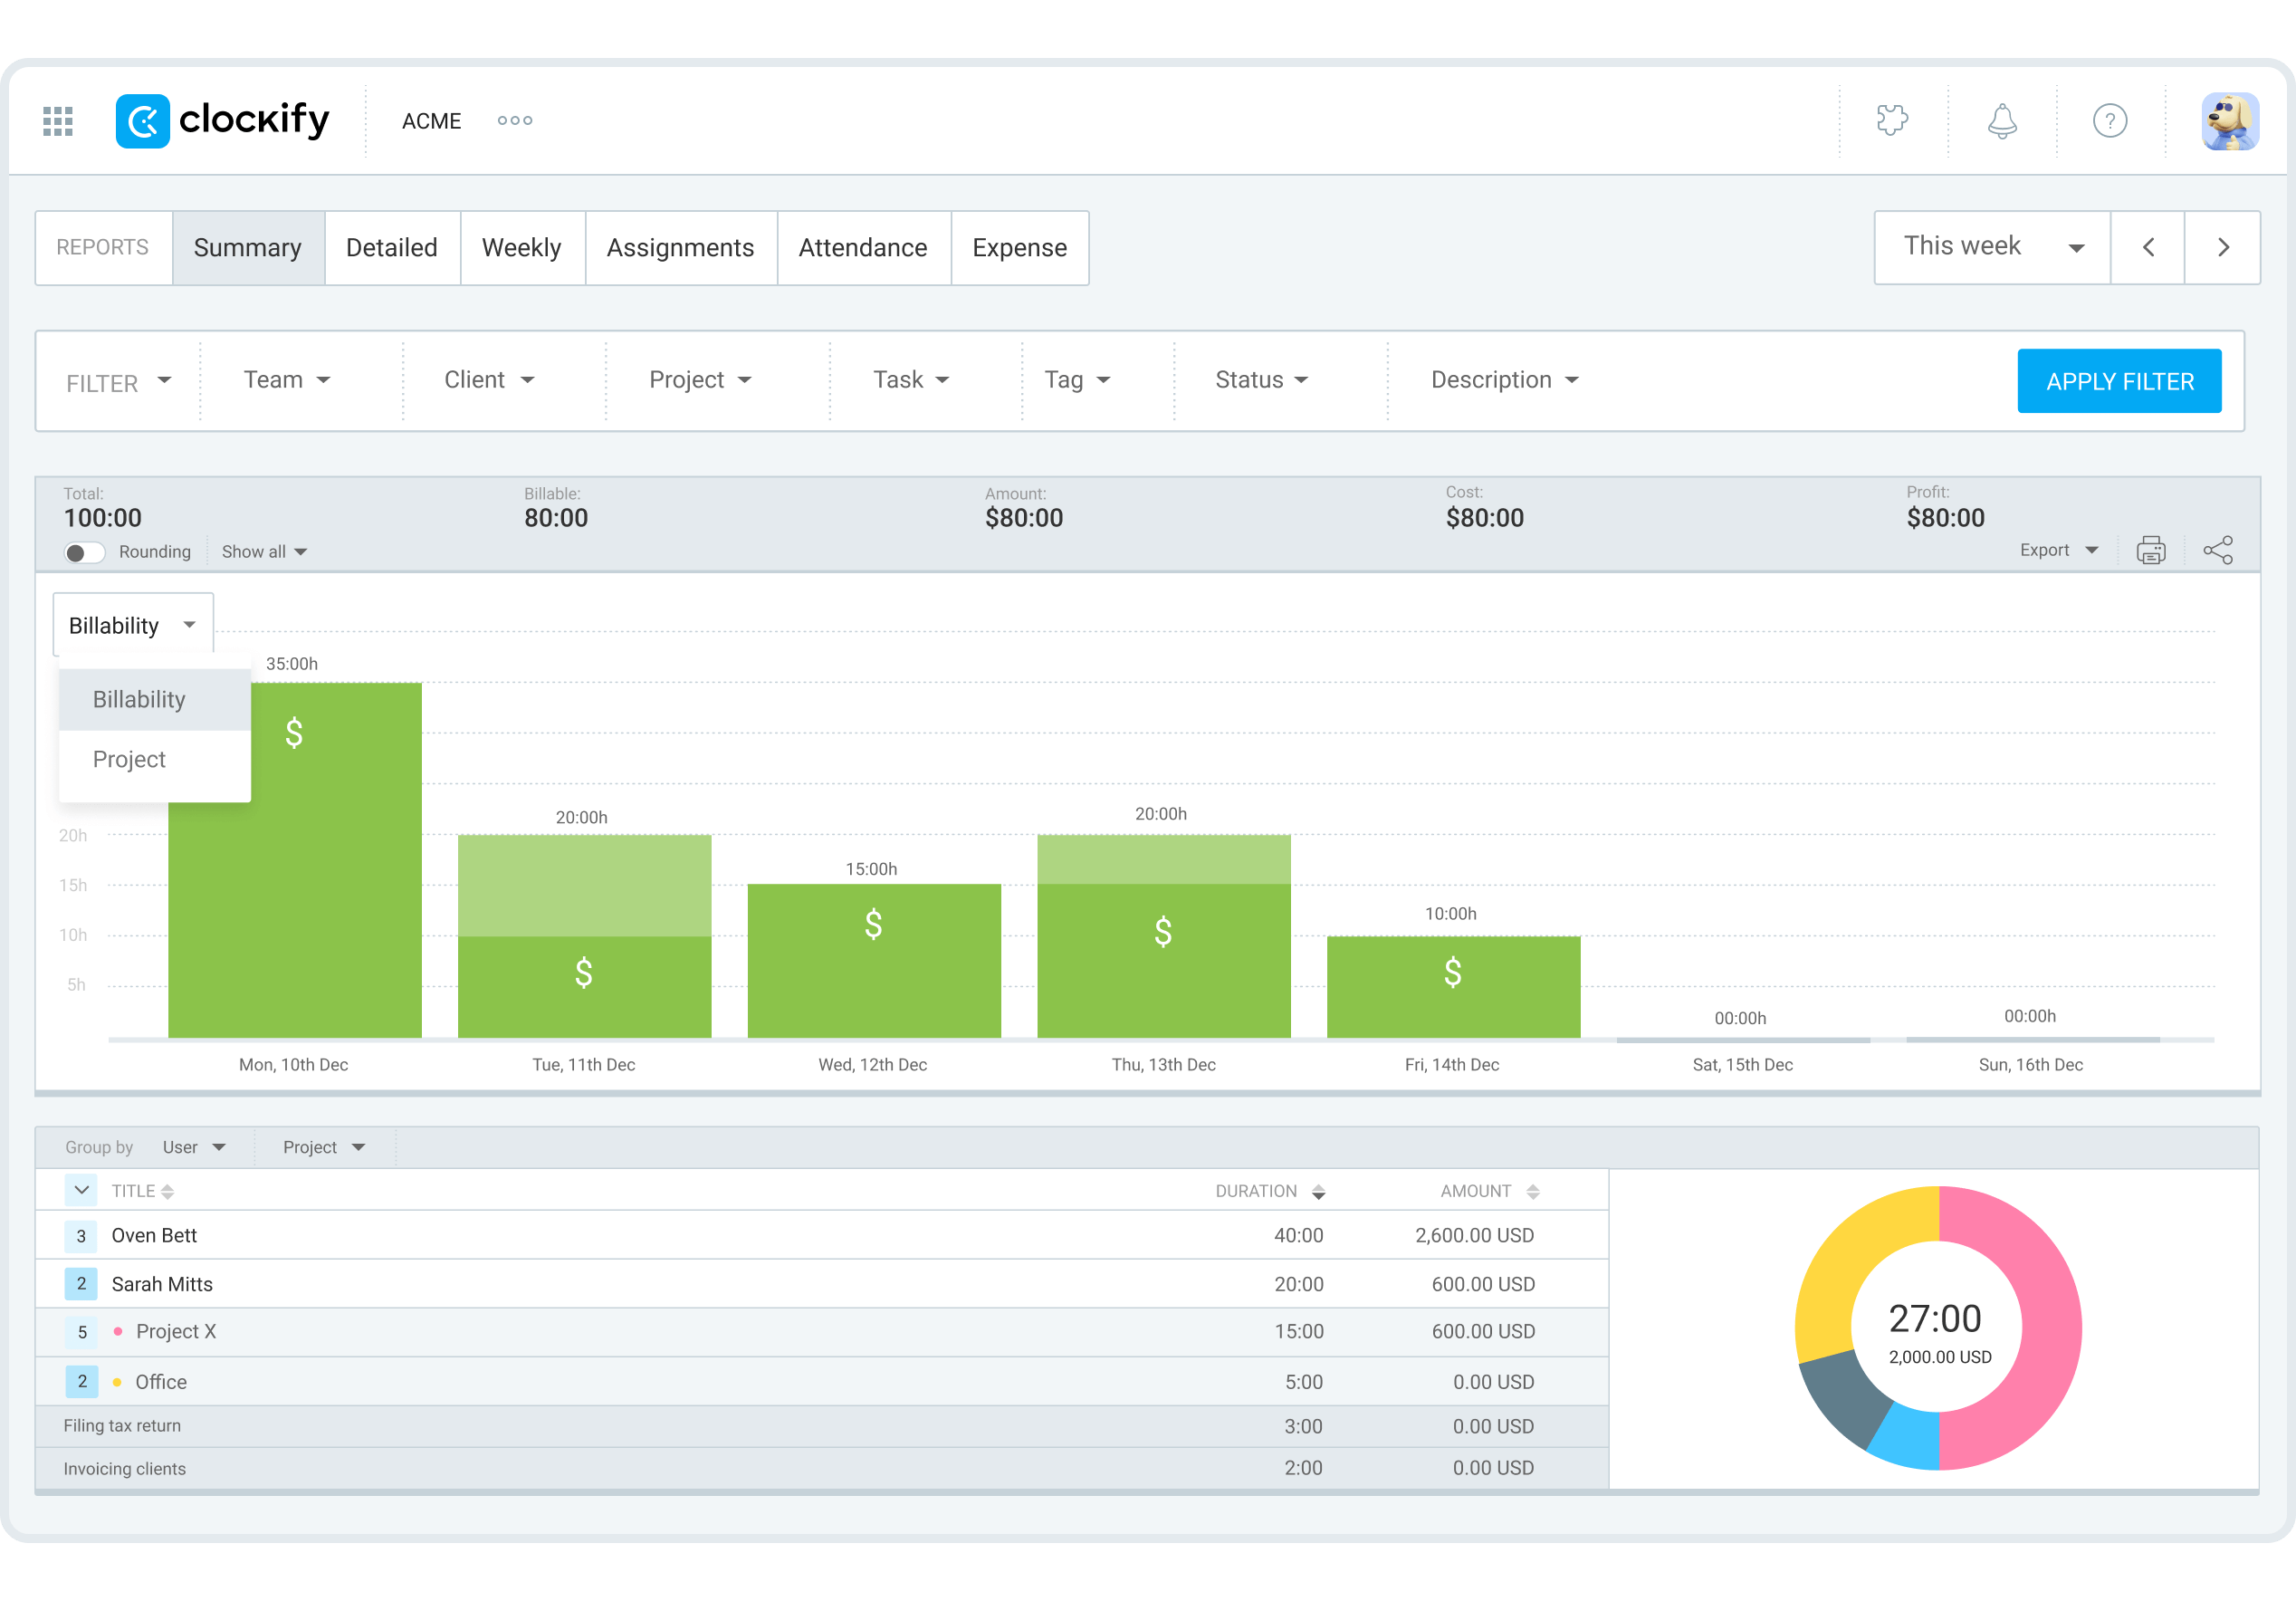
#2: Estimate project timelines and costs
Clockify’s Scheduling feature makes planning projects as simple as it gets. In fact, 31% of business leaders, team leads, and project managers use Clockify to:
#3: Adapt strategies in real-time
With Clockify’s Forecasting feature, you can get notified when a team member tracks too much time working on a task or project per day, week, or month.
In fact, Clockify data shows that 29% of survey respondents have used the forecasting feature at least once to:
#4: Improve processes with historical data
Fill out the sheets regularly and let data accumulate for a certain period. Then, use Clockify’s Reports feature to:
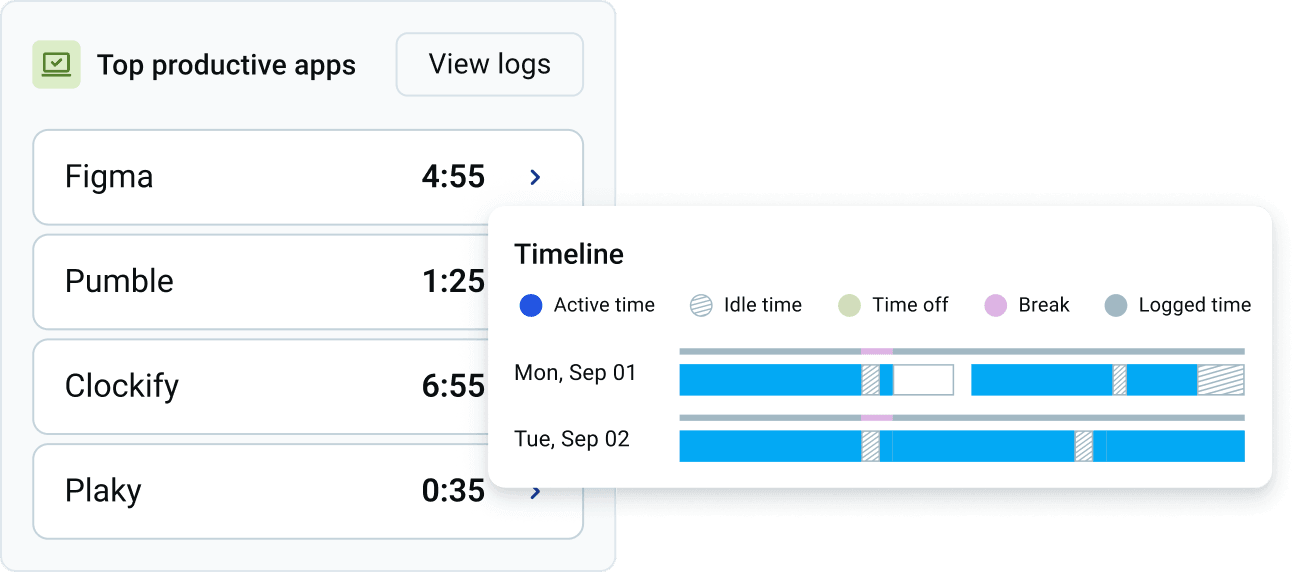
#5: Identify company bottlenecks with Activity monitoring data
From Pro plan and up, Clockify’s Activity monitoring gives you insights into:
Use this data to identify apps that drain funds and pinpoint overworked vs. underworked employees and teams.
To take it a step further, try other tools by CAKE.com — Plaky for project management and Pumble for team chat.

Finally, let’s take a look at other frequently asked questions about time tracking statistics.
Statistics about time tracking let you see:
Monitoring employee productivity can help you uncover management blind spots, prioritize tasks, and avoid overworking some employees while underworking others.
A dedicated team time tracker is the easiest and most powerful way to identify your time use trends and change them.
According to the aforementioned American Time Use Survey, Americans spent an average of 9 hours and 1 minute per day sleeping in 2025.
However, the most recent NCHS data show that almost 1/3 of American adults sleep less than 7 hours on average — below the recommended daily minimum.
A whopping 70% of employees in the US don’t take their paid time off. That leaves only 30% of workers using their PTO. The same research also claims that 16% of employees don’t get any PTO from their employers.
🎓 PTO vs. Vacation: What Is the Difference?
Time tracking directly impacts productivity because it helps you analyze:
According to Renee Kemper, a digital marketing professional and business owner, time tracking insights are especially important for creative tasks:

“When you can see the real workload, you stop treating every open hour as available and protect the space where better ideas happen.”
According to Zippia’s research, employees spend 12% of their work time browsing social media apps. In total, 77% of workers use social media at work.
One of the most common reasons employees spend time on social media at work is to:
Time tracking requires you to measure and compare how you spend time across the period you plan to analyze.
Time management is the act of implementing changes in your routine to improve how you use your time.
The two concepts work best when paired. Time tracking without a good strategy remains purely theoretical. On the other hand, time management without proper tracking can paradoxically waste even more time and energy on trial and error.
