Extras

Forecasting

Forecasting helps you visualize your project’s progress based on tracked time. See how you’ve performed on recurring projects for a set time period and make predictions based on scheduled assignments and add estimates or budget to see if the project will go over or under them.

Forecasting is an extra feature, available to admins only. You can enable it by upgrading your workspace to Pro or Enterprise plan.

User interface displayed in this video may not correspond to the latest version of the app.

Creating chart #

  1. Go to the Projects page from the sidebar
  2. Choose Forecast tab
  3. Pick a date or a time period in the future

Every point in the X axis will show the value of the specific time period you picked (day, week, month).

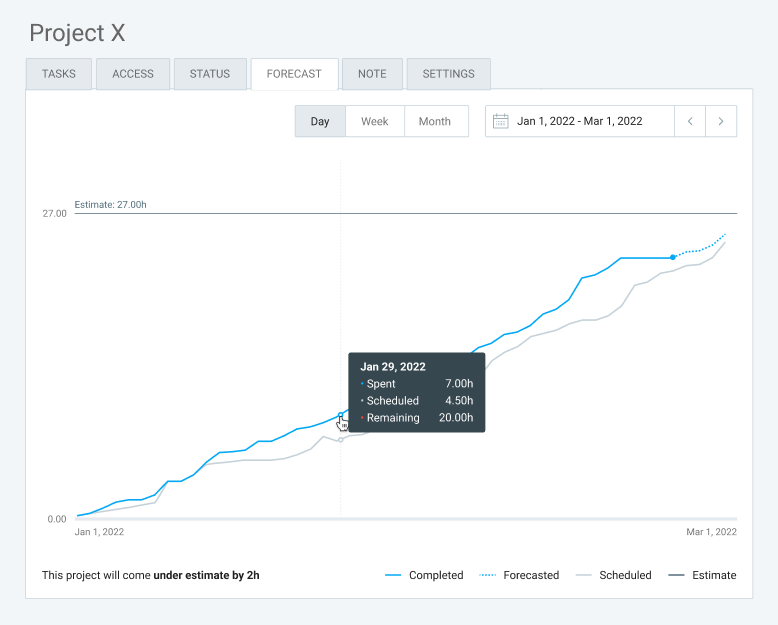
Day: Value in the x axis is in days and every point in the curve shows value by day. 
Week: Value in the x axis shows the whole week for every point.
Month: Value in the x axis shows the whole month for every point.

Forecasting project completion #

The chart shows project completion based on the project estimate and the hours that have been clocked in.

Completed (solid blue line)

Shows completed tasks based on the billable tracked time so far, meaning everything completed until present day.
If estimate reset is turned on, first point is 0, but last point is set in defined period (week, month, year).

Forecasted (dotted blue line)

Shows completed tasks based on billable tracked time plus future scheduled billable time. It starts with Today, which means that the Forecasted curve starts where the Completed curve ends. If it goes over the estimated horizontal line, the part of the curve that is over the estimate will be in red.  
If estimate reset is turned on, first and last point are set in defined period (week, month, year).

Scheduled (solid gray line)

Shows completed tasks based on scheduled billable hours on this project. This curve is connected to the Scheduling feature and takes scheduling assignments for the Y axis value (number of scheduled hours).
If estimate reset is turned on, then first and last point of the line need to be in the defined period (week, month, year).

Estimate (solid gray line or solid red line if projects goes over estimate) 

Shows completed tasks based on estimate in project settings.
If estimate reset is turned on, then first and last point are in the defined period (week, month, year).

If project estimate reset is set on a specific time of the day:

  • entries and assignments are always placed based on their start time: e.g. Weekly reset is set for today, 2pm. Assignment is scheduled from 12pm-6pm. The assignment is assigned to the first half of the day, which belongs to the previous week. This week’s time range is from 2pm today to midnight and there is no assignment in that period.
  • midnight is automatically assigned if assignment doesn’t have start time (belongs to the first part of the day) 
  • today’s dot on the chart always belongs to the Forecasted line: e.g. Estimate reset is set to 2pm, so the first part of the day belongs to the previous week, however, it will still have a forecasted value for that dot until today is over  

If week/month is selected from the period picker and Today is included in the selected period, everything up to Today is completed and everything after Today, to the end of the week/month is Scheduled. Therefore, Today’s tracked hours will be included in the total of Completed tasks after midnight, in your timezone.  

Was this article helpful?

Thank you! If you’d like a member of our support team to respond to you, please drop us a note at support@clockify.me