Forecast chart
Forecasting is a paid feature, available to admins only. You can enable it by upgrading your workspace to Pro or Enterprise plan.
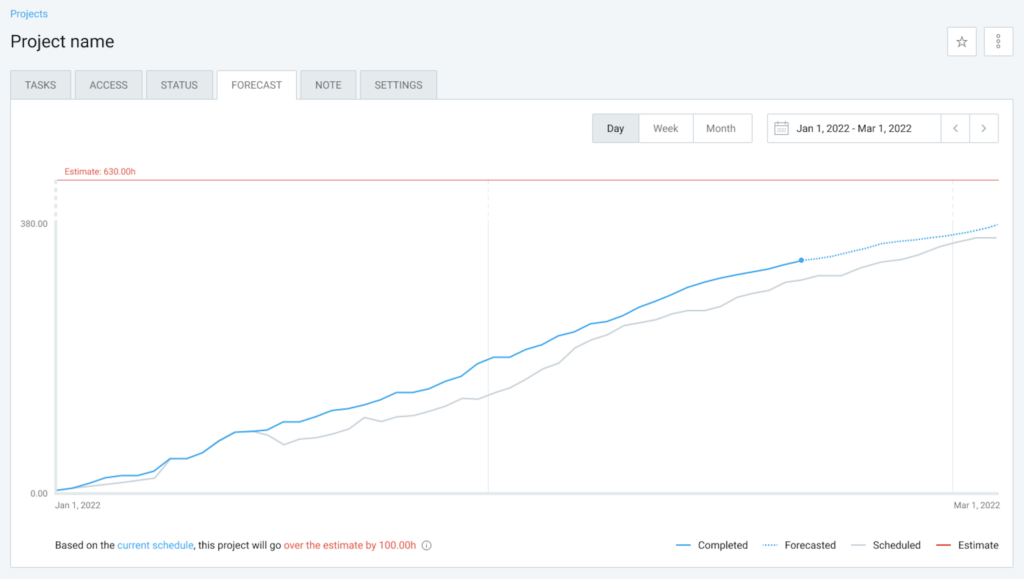
Forecasting chart shows project completion or project budget spent based on the project and budget estimate and the hours that have been clocked in.
Project completion chart #
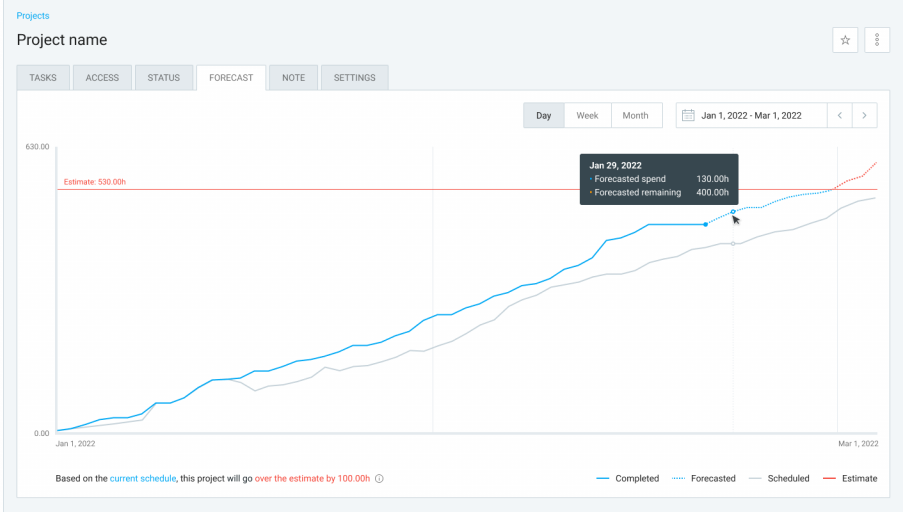
Completed (solid blue line)
Shows completed tasks based on the billable tracked time so far, meaning everything completed until present day.
If estimate reset is turned on, first point is 0, but last point is set in defined period (week, month, year).
Forecasted (dotted blue line)
Shows completed tasks based on billable tracked time plus future scheduled billable time. It starts with Today, which means that the Forecasted curve starts where the Completed curve ends. If it goes over the estimated horizontal line, the part of the curve that is over the estimate will be in red.
If estimate reset is turned on, first and last point are set in defined period (week, month, year).
Scheduled (solid gray line)
Shows completed tasks based on scheduled billable hours on this project. This curve is connected to the Scheduling feature and takes scheduling assignments for the Y axis value (number of scheduled hours).
If estimate reset is turned on, then first and last point of the line need to be in the defined period (week, month, year).
Estimate (solid gray line or solid red line if projects goes over estimate)
Shows completed tasks based on estimate in project settings.
If estimate reset is turned on, then first and last point are in the defined period (week, month, year).
Possible scenarios #
If project estimate reset is set on a specific time of the day:
- entries and assignments are always placed based on their start time: e.g. Weekly reset is set for today, 2pm. Assignment is scheduled from 12pm-6pm. The assignment is assigned to the first half of the day, which belongs to the previous week. This week’s time range is from 2pm today to midnight and there is no assignment in that period.
- midnight is automatically assigned if assignment doesn’t have start time (belongs to the first part of the day)
- today’s dot on the chart always belongs to the Forecasted line: e.g. Estimate reset is set to 2pm, so the first part of the day belongs to the previous week, however, it will still have a forecasted value for that dot until today is over
If week/month is selected from the period picker and Today is included in the selected period, everything up to Today is completed and everything after Today, to the end of the week/month is Scheduled. Therefore, Today’s tracked hours will be included in the total of Completed tasks after midnight, in your timezone.
More information on how to Forecast project completion
Project budget chart #
Forecasting budget chart shows project expenses based on the estimated budget allocated to that project. Budget forecasting supports budget estimates using scheduled assignments, time entries, and expenses. The chart reflects either the set budget or the highest value reached if the budget is exceeded.
If no data is available for the project (e.g. time entries, expenses, estimates), the forecasting chart will be empty.
Legend #
Chart legend is located at the top-right corner of the page.
The chart displays three lines:
Completed (solid blue line)
Represents the total budget spent up to the present day. The completed line is not displayed for future periods.
Forecasted (dotted blue line)
Represents the prediction of the project’s progress based on realized and scheduled data. It starts with Today and changes its look once it becomes a budget.
Budget (solid dark gray line)
Static, horizontal line that represents the budget set per project.
Each line represents a continuous trend from the first to the last data point. Lines show both ascending and descending trends with cumulative values.
If a budget reset is configured, the line will be color-coded to indicate whether the estimate has been exceeded (e.g. the line turns red if the budget is exceeded).
Budget reset #
If a budget reset is enabled, the estimates will adjust accordingly: weekly, monthly, or yearly, each indicating the project will be under/over/on budget by Y [currency] for the respective time period.
Possible scenarios #
1. Project budget hasn’t reached estimated value
Forecast curve hasn’t reached the budget line, meaning the last point shows a remaining value greater than zero. Currently, the project is expected to come in under budget by Y [currency].
2. Project budget reached estimated value
Forecasted curve has reached the budget line and the last point shows a value equal to zero. The project is within the estimated budget range expressed in Y [currency].
3. Project budget is over estimated value
The forecast curve has exceeded the budget line, showing a remaining value less than zero. This means the project is expected to go over budget by Y USD, where Y is the absolute value of the last forecast point.
More on how to Forecast project budget