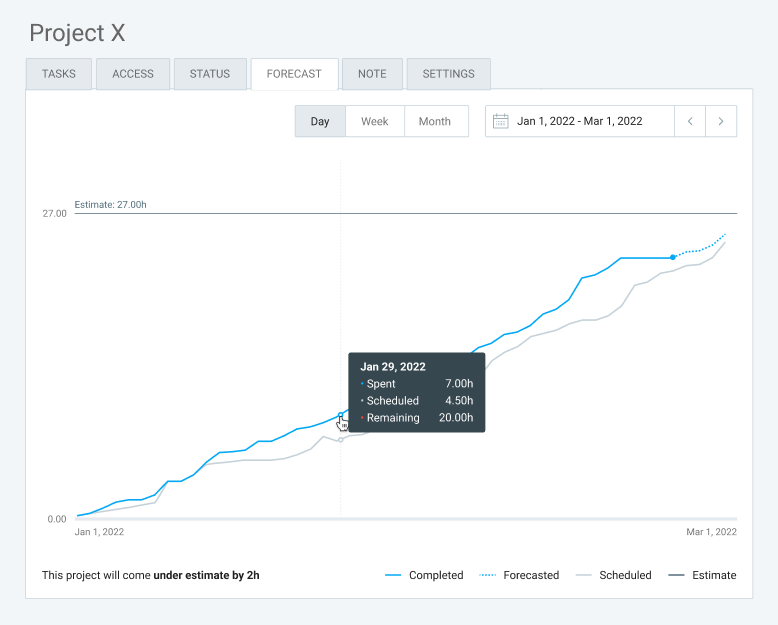
Forecast project completion
Forecasting helps you visualize your project’s progress based on tracked time. See how you’ve performed on recurring projects for a set time period and make predictions based on scheduled assignments and add estimates or budget to see if the project will go over or under them.
Forecasting is a paid feature, available to admins only. You can enable it by upgrading your workspace to Pro or Enterprise plan.
Create chart #
- Go to the Projects page from the sidebar
- Choose Forecast tab
- Pick a date or a time period in the future
Every point in the X axis will show the value of the specific time period you picked (day, week, month).

Day: Value in the x axis is in days and every point in the curve shows value by day.
Week: Value in the x axis shows the whole week for every point.
Month: Value in the x axis shows the whole month for every point.
Check out Forecasting project completion chart for more details.