Customize reports
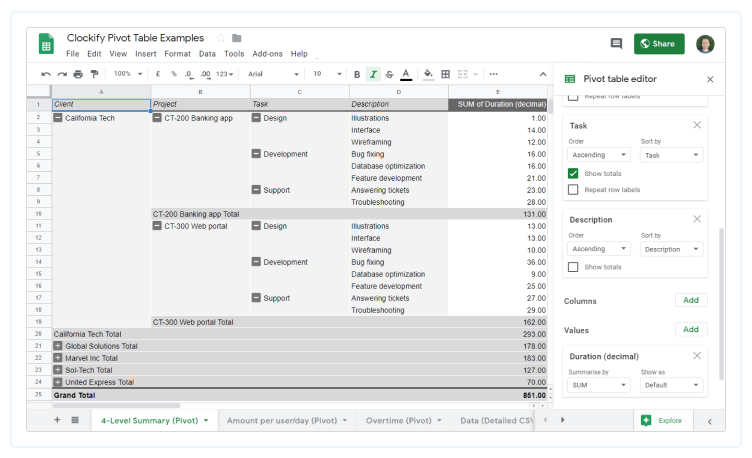
If Clockify’s built-in reports and customization options don’t provide the structure you need, create your own report using pivot tables in Excel/Google Sheets.
Simply export the Detailed report’s as CSV or Excel, and you can create any kind of report you want:
- Total hours (or amount) broken down by client > project > task > description
- Monthly report with total hours (or amount) per project (or user) per day
Create custom report #
Create a custom report in the following way:
- Export Clockify’s Detailed report in CSV or Excel and open it in Google Sheets or Excel
- Select the whole table
- Excel: go to Insert > Pivot Table; Google Sheets: go to Insert > Pivot Table
- Click OK
- Choose what fields to show in rows/columns, and what to display as values. Example: “Row: Project”, “Column: User”, “Value: Duration (decimal)”
Additional dimensions #
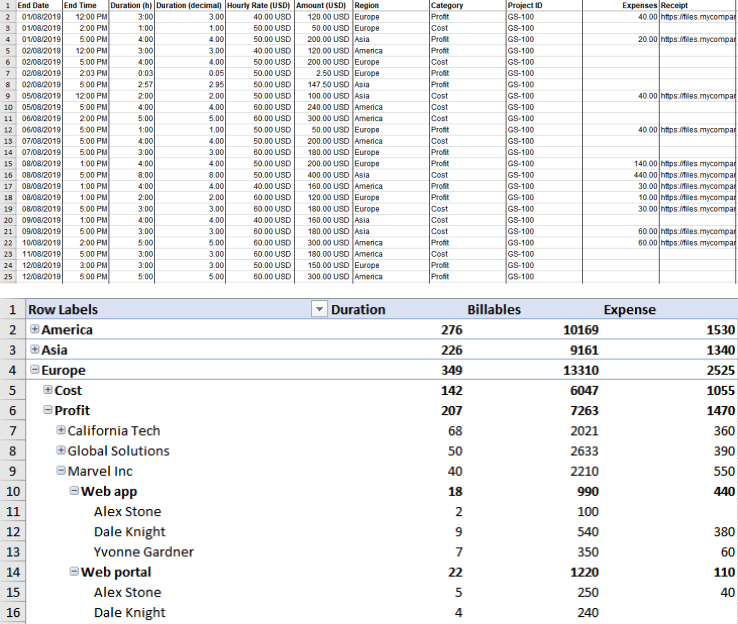
You can enrich reports using custom fields on time entries. Your users can track all sorts of things, like expenses, mileage, units, etc.
You can also add metadata to time entries using custom fields on projects. That way, you’ll have more options for grouping time in pivot tables.
Download sample report with custom fields (Excel)

Overlapping entries #
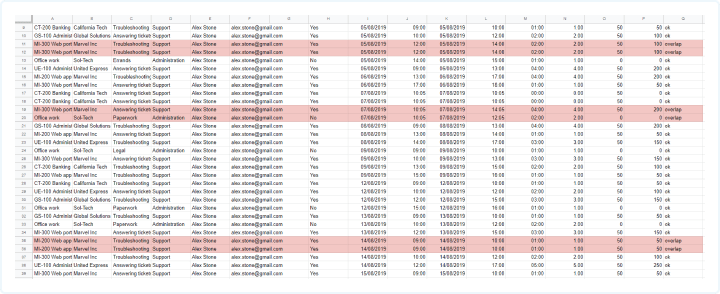
If you have entries with overlapping start and end times, you can easily find them in Excel or Google Sheets.
- Export Clockify’s Detailed report in CSV
- Open CSV in Excel/Google Sheets
- Select all data and sort it by: User>Start Date>Start Time
- Create a new Overlap column
- For the first record, use this formula: =IF(OR(IF($F1=$F2, IF($I2=$I1, IF($L1>$J2, true, false))),IF($F2=$F3, IF($I2=$I3, IF($L2>$J3, true, false)))),”overlap”, “ok”)
- Expand and apply the formula for each row
- Apply conditional formatting to highlight overlapping time entries
- Create pivot table based on the data in the table
- In Pivot table, select: Row:Overlap, Value:Overlap (count)
- Click on the overlapping count to see only the overlapping entries in a new sheet
How the formula works: Once all the entries are sorted, the formula compares the previous and the next row. If the rows are from the same user and from the same date, it looks if the entry’s start time overlaps with previous entry’s end time or if its end time overlaps with next entry’s start time.
See example of overlapping entries (Google Sheets)

