When looking to purchase business forecasting software, you will undoubtedly face the question — how do you find the best forecasting software for your business?
According to an OR/MS Today survey, there have never been more forecasting software options on the market than now. Furthermore, software companies have started using artificial intelligence and adding more and more features to improve their tools and make forecasting more accurate.
Consequently, searching for business forecasting software with standout features can take months. Luckily for you, we present the top 9 best business forecasting tools in this blog post. We’ll also go over the benefits of using these tools, as well as the useful features they should have.

Table of Contents
What is forecasting software?
Forecasting software is a specialized tool that assists managers and team members in forecasting the future conditions of their business. These tools use predictive analytics to help managers see and anticipate what will happen next regarding their business, whether it be the future of sales, finances, or projects.
Some businesses that use forecasting tools are:
- Finance,
- Construction,
- Energy production,
- Automotive,
- Aerospace, and
- Software companies.
Moreover, forecasting software gives managers insight into certain numbers they couldn’t usually obtain otherwise.
However, truly excellent forecasting software can predict the future state of your company as well as the success of your projects based on the data and facts you have obtained.
💡Clockify Pro Tip
If you want to find out more about forecasting in project management specifically, you can read our blog post:
Types of business forecasts based on what aspect of a business they focus on
There are various types of business forecasting based on what these forecasts focus on — since we can forecast different aspects of a business.
Here is the quick overview of the most common types of business forecasting.
Type #1: General business forecasting
General business forecasting is used to identify overall market conditions and the effect of different external factors on your business.
These external factors can be:
- Technology development,
- Political and legal factors,
- Economic factors,
- Competitive factors,
- Ethical and natural factors, and more.
Type #2: Accounting forecast
An accounting forecast helps predict how much your company will spend on future business expenses such as:
- Raw materials,
- Inventories,
- Employees work hours,
- Utilities and rent,
- Insurance, and more.
Type #3: Sales forecasting
The goal of sales forecasting is to predict how many products or services will be sold, and how much revenue will be earned from those sales over a particular period of time.
There are:
- Weekly,
- Monthly,
- Quarterly, and
- Yearly sales forecastings.
Sales forecasting is one of the most important types of forecasting a company can perform — it serves as the foundation for the entire business planning process. You need sales forecasts for:
- Budget planning,
- Employee hiring,
- Resource planning and allocation,
- Marketing, and more.
Type #4: Financial forecasting
Financial forecasting estimates a company’s overall financial value.
It includes calculating:
- Assets and liabilities,
- Capital and cash flow,
- Projects costs, and
- Operating costs.
Type #5: Market forecasting
Market forecasting is a type of forecasting you can use to estimate what the market needs or wants are. With this type of forecasting, you can predict the future market trends and customer demands so that you can adapt your business to the market and offer desired products and services.
Market demands can be affected by:
- Economic conditions,
- Customers’ income, and
- Seasons, among other parameters.
Market forecasting can assist you in determining and predicting how many products or services must be available to your customers for you to always have enough stock.
If you run out of stock, your customers will quickly find other suppliers — i.e. the brands of your competitors — to serve as alternatives.
Type #6: Budget forecasting
Budget forecasting estimates how much money will be needed for future projects and helps you address potential issues — such as:
- Unexpected costs,
- Equipment failure, and
- Shortage of resources or materials.
Moreover, budget forecasting helps your company:
- Plan for the future,
- Set realistic and attainable goals,
- Keep an eye on expenses, and
- Work on business development.
💡Clockify Pro Tip
Learn about the importance of tracking your expenses and how to do it here:
Type #7: Project forecasting
Project forecasting is predicting the future outcomes of a project and ensuring the most favorable project outcomes.
We usually use project data analytics to assess past data and the current state of a project to estimate the future results of the project.
Based on precise estimates, project forecasting can often help reduce project risks and ensure project success.
Types of business forecasts based on the time period they forecast
According to Shri Ganeshram, the CEO of Awning.com, we can also categorize business forecasts based on the time period they forecast:
- Short-term forecasts,
- Medium-term forecasts, and
- Long-term forecasts.
Type #1: Short-term forecast
Here’s how Ganeshram explains short-term forecasts:

“Short-term forecasts focus on the next month or quarter and are used to plan for immediate operations and management decisions.”
Type #2: Medium-term forecast
For Ganeshram, this is the gist of medium-term forecasts:
“Medium-term forecasts focus on the next 1–2 years and are used for strategic planning and budgeting.”
Type #3: Long-term forecasts
Finally, there are also long-term forecasts. According to Ganeshram’s definition:
“Long-term forecasts focus on 5 years and more, and are used for long-term strategic planning and decision making.”
Types of forecasting tools
The following are some of the most common forecasting tools that will help you examine data or trends and create accurate forecasts to help your business run smoothly.
Type #1: Cash-flow statements
According to Corporate Finance Institute (CFI), cash-flow statements refer to “the cash generated and spent during a specific period of time (e.g., a month, quarter, or year)”, and in simple terms, cash-flow statements show “how much money moved in and out of business.”
Cash-flow statements can also include:
- Selling assets,
- Debt repayments, or
- Grants.
Money that goes into your business includes:
- Employees wages,
- Bills,
- Taxes,
- Maintenance,
- Payments to suppliers, and
- Other expenses.
The cash-flow statements are one of those important tools for your business as they will tell you whether you have enough money to operate your business or not.
Type #2: Internal reports
To create a reliable business forecast, managers should opt for internal reports that show the company’s internal data. These reports are used for forecasting future results, but also comparing the real results with forecasted ones.
Internal reports give you information about:
- Labor and payroll,
- Sales,
- Production,
- Development, and
- Outcomes of operation.
💡Clockify Pro Tip
If you want to find out more about tracking progress and estimates and how to do it, go to our page:
Type #3: Predictive modeling tools
According to TechTarget, predictive modeling is “a type of data analytics which uses current and historical data to forecast activity, behavior, and trends.” Modeling tools simplify the process of forecasting by using AI to analyze data and accurately predict the results of your business. Managers often use them to:
- Forecast sales, market demands and pricing fluctuations,
- Find out customers’s habits,
- Predict whether someone will click on a link, or
- See whether any historical events may happen again in the future.
As stated in the PMBOK guide, there are two types of predictive modeling techniques that these tools use:
- What-if scenarios analysis — “The process of evaluating scenarios in order to predict their effect, positively or negatively, on project objectives.” In other words, it is the analysis of different what-if scenarios and their effects on projects or the whole business. It uses artificial intelligence to predict what is most likely to happen based on the scenarios you choose. For example, what will happen to your business if you invest more in marketing or if the viewing habits of your audience change.
- Simulations — Can be performed on the level of a whole business, a specific aspect of a business, project, portfolio, campaign, and more. Before you make any serious and final decisions about your business or a project, you can test your ideas through these simulations.
Simulations let you manipulate different parameters such as:
- Costs,
- Revenue,
- Cash-flow,
- Risk of investing in new products, and
- Time needed to finish work.
As a result, you can see different outcomes, mitigate risks and make better decisions regarding your business and projects.
Simulation lets you preview the different results and durations of different activities, usually based on three-point estimates or the PERT method (optimistic, pessimistic, and most likely estimations).
💡Clockify Pro Tip
If you want to learn more about time estimates and PERT technique, read:
Type #4: Performance metrics
When developing a business forecast, managers should be aware of their company’s performance indicators. Performance metrics are essential for monitoring your company’s performance and revenue. This will help you determine which aspects of your business need more attention in order to grow.
Some performance indicators are:
- New customers growth,
- Duration of tasks and projects, and
- Sales growth.
Type #5: Organization charts or diagrams
Organization charts or diagrams give you a visual representation of the internal structure of your company, as well as the position and responsibilities of every employee in your company. Such charts or diagrams contain information such as:
- Names,
- Positions,
- Photos, and
- Contact information of each employee in a company.
Moreover, these visual aids can show you whether you have a staff shortage, or you can use them to divide one large department into fewer smaller ones so you can improve employee productivity and efficiency.
Type #6: Time series charts
We use visual representations of activities in a company over a certain period of time, such as time series charts, for collecting different data. They can help you have a better understanding of the changes in your business, occurring patterns, and trends in the market and thus create more accurate forecasts.
Some changes are obvious because they follow seasonal patterns. For instance, tourism profits are the highest in the summer, and retail sales are the highest during Christmas.
Other variables, on the other hand, are much more difficult to predict. These variables include:
- Stock market prices,
- Inflation rates,
- Unemployment rates, and
- Company’s market share.
So, that’s why you can use time series charts to analyze different variables which can affect your business.
For example, if you forecast your company’s market share for the next several months and notice a decline in your market share, you can adjust your budget and invest more in advertising to gain more customers.
Why use a forecasting tool?
Clive Humby, a UK mathematician and architect, once said: “data is the new oil” — thus, one must separate and analyze it to be useful.
Now, how can we apply this statement to business forecasting? In business forecasting, the data we have about company helps us:
- Create a simulation of various business scenarios,
- Increase company’s profits,
- Predict all the possible scenarios, and consequently,
- Lower business risks.
And, when using a forecasting tool, managers can automate the process of in-depth data analysis.
Here is the list of some of the common benefits of using forecasting tools.
Benefit #1: Forecasting tools can help you reduce forecasting costs
According to Mina Tadrus, the CEO of Tadrus Capital LLC, forecasting software considerably lowers the cost of forecasting compared to manual or even in-house forecasting teams:

“This allows businesses to minimize operational costs while maximizing the amount of time they can spend on perfecting their strategies rather than collecting and analyzing data manually.”
Furthermore, reduced forecasting costs can allow you to allocate funds to other parts of your company.
Benefit #2: Forecasting tools give you accurate data
Mina Tadrus also believes that one of the greatest advantages of business forecasting tools is that such tools ensure accurate data.
He further explains that:
“By harnessing real-time market data and analyzing it with complex algorithms, business forecasting apps are able to give accurate predictions on market trends, customer demand, market share, and more. With this reliable information, businesses can make informed strategic decisions based on past and current performance to drive toward better outcomes.”
Benefit #3: Forecasting tools help you plan your finances
One of the crucial tasks, when it comes to doing any type of business, is creating an accurate financial plan. Forecasting allows you better financial planning, as you will anticipate the costs and its overruns better and thus prepare accordingly.
Forecasting tools will help you make sure you have the necessary funds available at all times. What’s more, financial forecasting can also aid in situations where you have to make changes during an on-going project.
Benefit #4: Forecasting tools let you schedule more accurately
Another standout advantage of forecasting software is the ability to make clear estimates on how long projects and tasks will take to finish. Scheduling becomes easier and more accurate when you know exactly how much time you will need for each task.
💡Clockify Pro Tip
If you need more help with making an efficient schedule for your team, read our blog post:
Benefit #5: Forecasting tools help you meet your customers’ needs
If you run a customer-based business, customer satisfaction is a crucial factor for your company’s success.
Aside from finances, time, and quality of your products, when you run a company, you must consider your customers’ needs and levels of satisfaction. Always remember that a happy customer is more likely to return and recommend you to other customers.
Forecasting tools can help you anticipate your customers’ expectations, the required time to finish projects, and work quality. Such tools also allow you to make changes to earn positive feedback and increase customer satisfaction.
To sum up, forecasting tools help you meet your customers’ expectations and keep your promises regarding work quality and delivery time.
Benefit #6: Forecasting tools help you set realistic goals
Before you even start a business, you have to determine what it is that you want to achieve. Setting goals is a delicate job, and business forecasting software can help you in many ways.
The appropriate tools will help you determine realistic and attainable goals based on factors such as:
- The time needed for a project, a product, or a service as well as individual tasks,
- Available resources, and
- Your team’s skills.
Forecasting tools will give you a clear and precise picture of an achievable goal so that the business success is guaranteed.
💡Clockify Pro Tip
If you want to find out more about keeping track of the progression of your goals and which tool to use for, read our blog post:
What are the best forecasting tools?
Forecasting tools are designed to show you your business progress at each stage — past, present, and future.
So, without any further ado, here is a list of the best business forecasting tools.
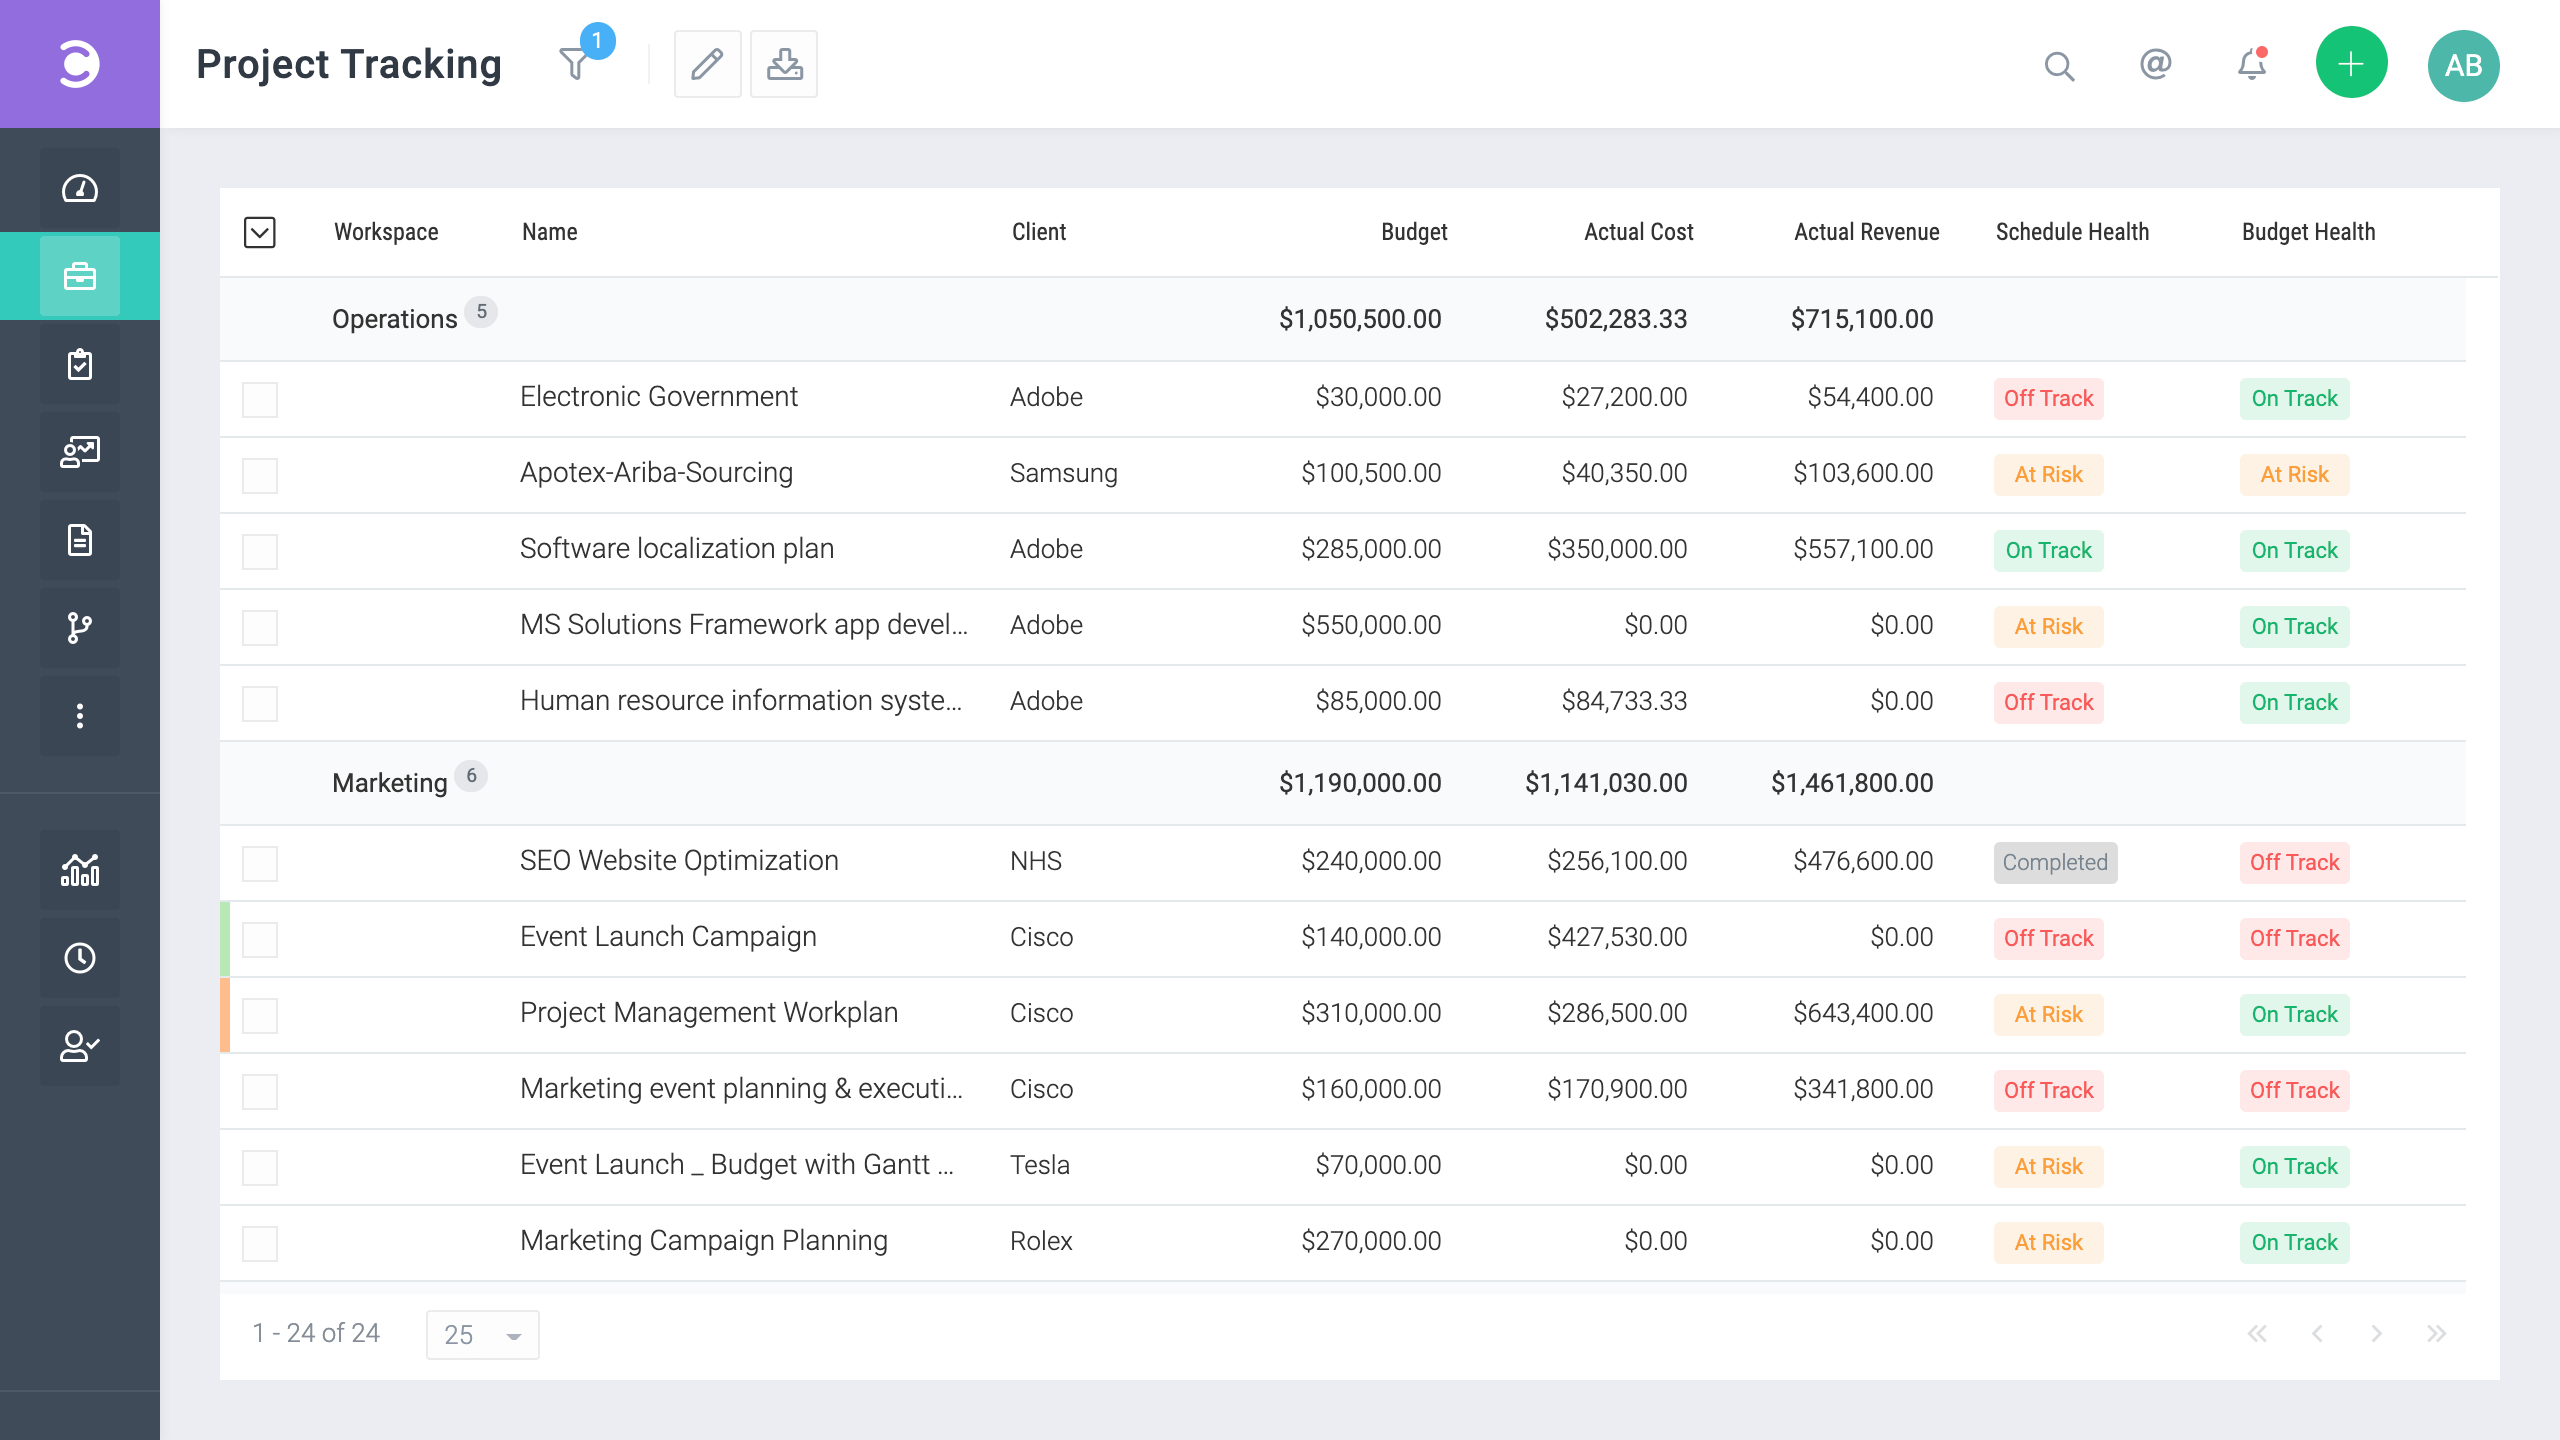
#1 Clockify — best for tracking time across tasks and projects
Clockify is among the most popular time-tracking software with a broad range of features, including forecasting.
Clockify gives you a clear visual representation of your progress through a chart based on tracked time. With this tool, you can:
- See your progress — daily, weekly or monthly,
- Make forecasts based on scheduled tasks, and
- Track estimates to see how accurate they are.
Clockify’s key features
Other Clockify features that help you with forecasting are:
- Clockify reports,
- Project scheduling, and
- Integrations with over 80 apps, including Pumble, Gmail, Google Docs, Github, Plaky, and others.
| Type of plan | Clockify pricing |
|---|---|
| Free trial | Yes |
| Free plan | Yes |
| Cheapest paid plan | $3.99 per user/month billed annually |
The forecasting feature is available to admins only, and you can enable it by upgrading your plan to a Pro or Enterprise plan.
#2 Forecast — best for AI powered analysis
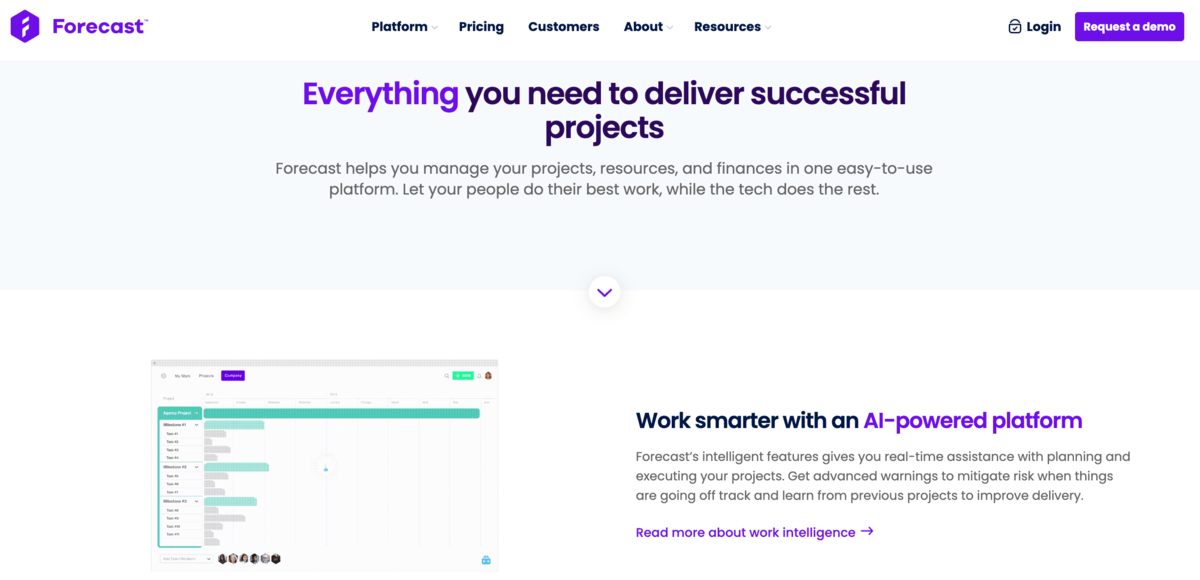
Forecast is the first business forecasting tool that employs machine learning for developing predictions by analyzing project data, and providing you with useful knowledge about your business as a result.
What’s more, Forecast generates financial and task duration predictions based on your business history.
Forecast’s key features
Furthermore, with Forecast, you get features such as:
- Time tracking,
- Planning,
- Budgeting, and
- Resource management.
| Type of plan | Forecast pricing |
|---|---|
| Free trial | No |
| Free plan | No |
| Cheapest paid plan | $29 seat/month, minimum 10 seats |
#3 Cube — best for mid-market businesses
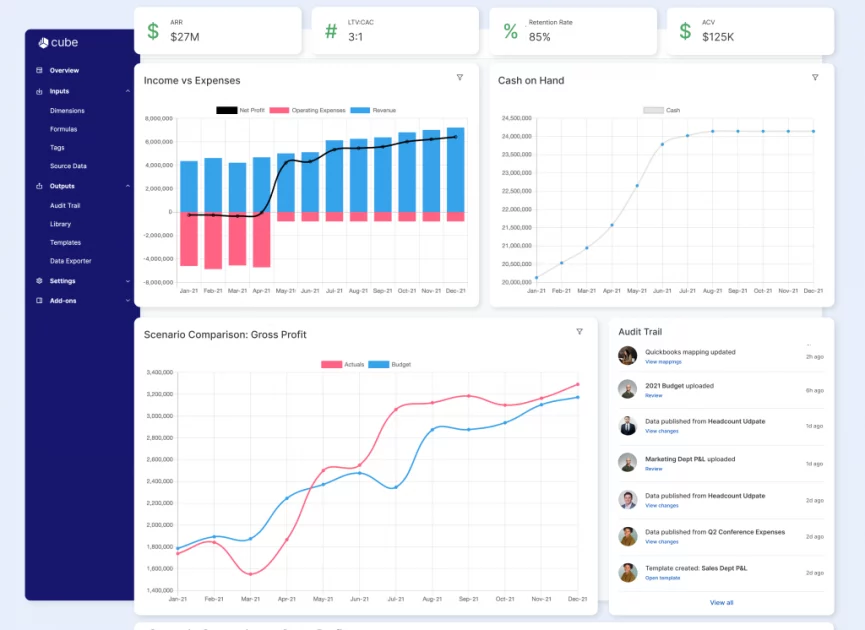
Cube is a fantastic forecasting tool that is ideal for mid-market businesses looking to complete their projects more quickly and affordably.
With Cube, you will be able to make more precise financial forecasts and you will have more control over your project while making fewer mistakes at the same time.
Cube’s key features
The main Cube features include:
- Shareable templates for project planning,
- Automated data integration,
- Adjustable dashboards and reports, and
- Integration with Excel and Google Sheets.
| Type of plan | Cube pricing |
|---|---|
| Free trial | No |
| Free plan | No |
| Cheapest paid plan | Starting at $1,250 per month, for 2 admins & 2 contributors |
#4 Anaplan — best for large and complex companies
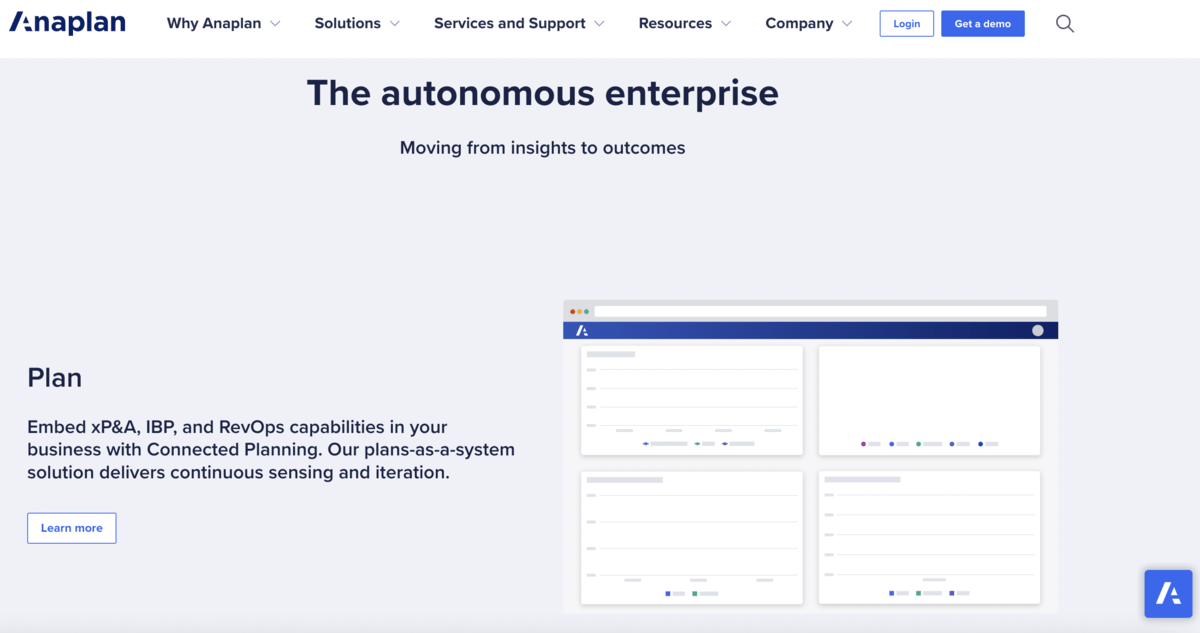
Anaplan is software used for quicker and more accurate forecasting. It is suitable for large and complex projects and companies.
This app also specializes in financial forecasting. It has a Predictive insights feature that allows you to find the best possible project outcome and ensure increased revenue.
Anaplan’s key features
Anaplan’s most notable features include:
- Planning,
- Budgeting,
- Improved forecasting performance with automated procedures and a cloud-based planning platform,
- Automated cost management, and
- Big-picture financial planning.
| Type of plan | Anaplan pricing |
|---|---|
| Free trial | No |
| Free plan | No |
| Cheapest paid plan | Contact them |
#5 Runn — best for resource management and scheduling
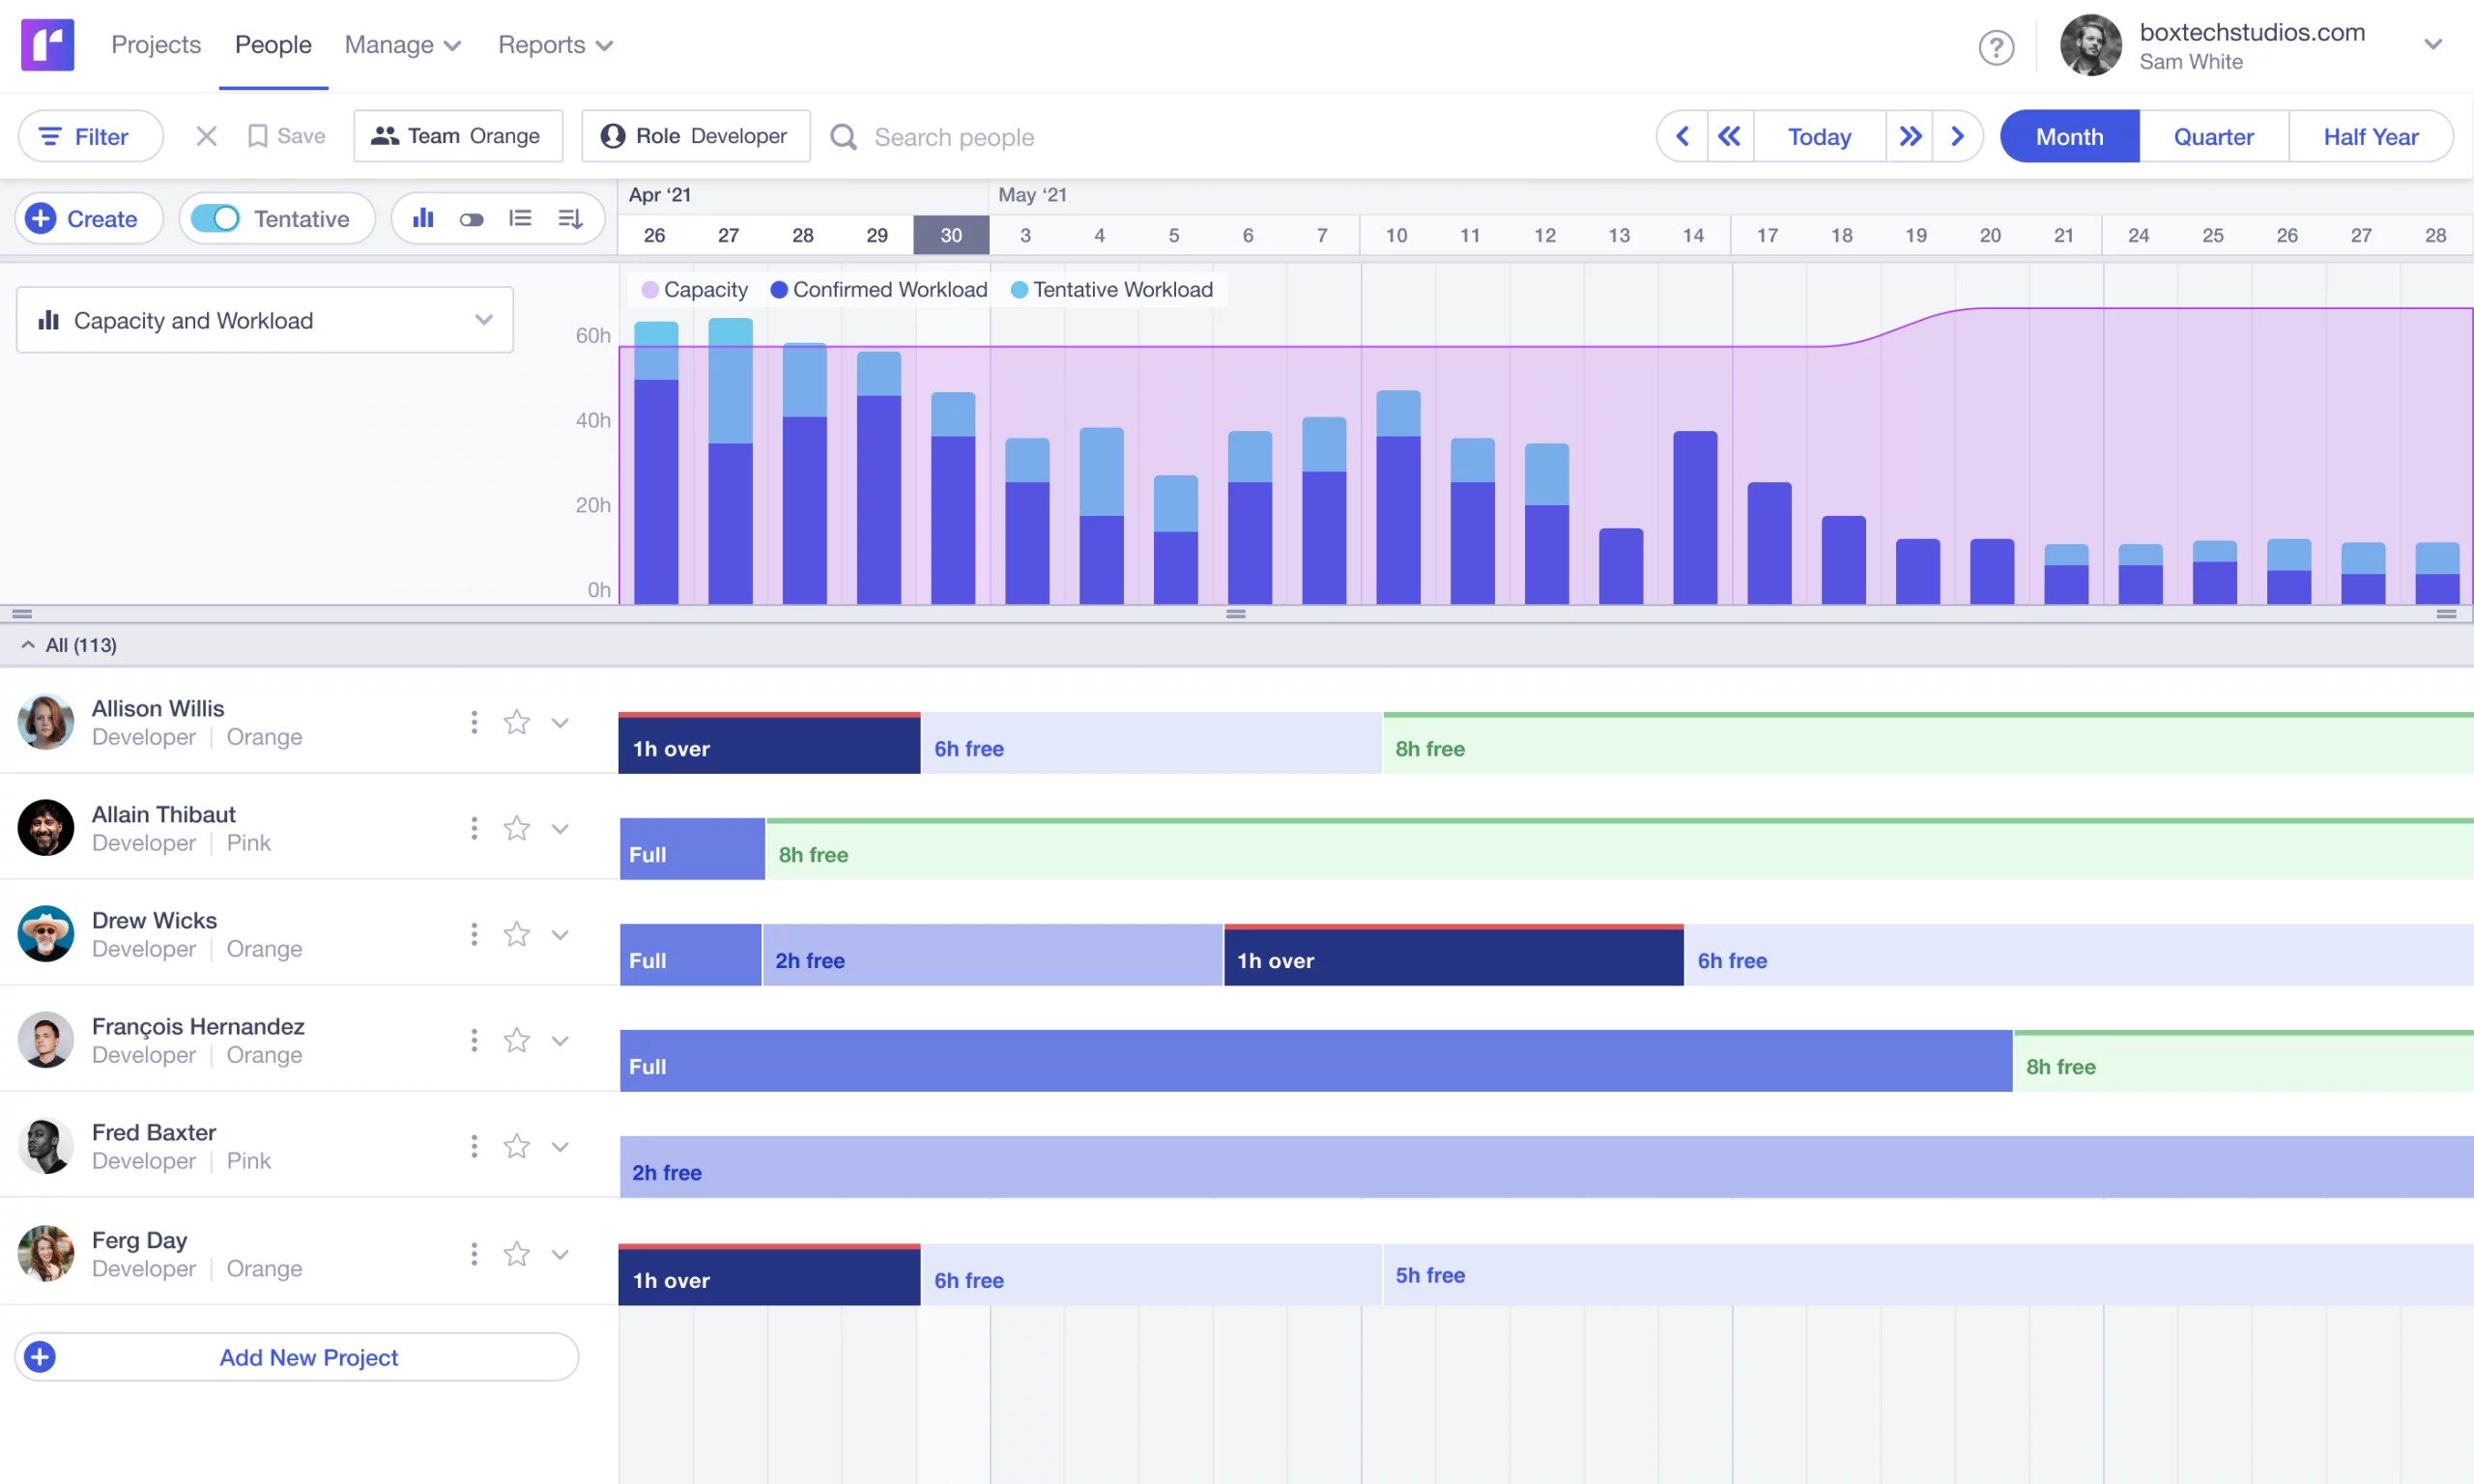
Runn is primarily a resource management platform — but it also functions as an efficient business forecasting tool. Companies that mostly use this app are software companies, architecture, engineering, consulting firms, and digital agencies.
Runn forecasts your team’s capacity, cost, and profits. You will get a clear representation of this information through charts and in real time.
This tool will calculate the feasibility of your plan by taking into consideration the available resources, so the whole process of forecasting becomes much easier and faster.
You can integrate Runn with apps such as WorkflowMax and Clockify to import people, clients, and data and track time.
Run’s key features
Runn includes the following features that may aid your forecasting:
- Resource scheduling,
- API and integrations,
- Planning,
- Timesheets,
- Capacity management, and
- Reports.
| Type of plan | Runn pricing |
|---|---|
| Free trial | Yes |
| Free plan | Yes — up to 5 people managed, unlimited projects |
| Cheapest paid plan | $10 per month/person managed |
#6 Epicflow — best for task prioritization
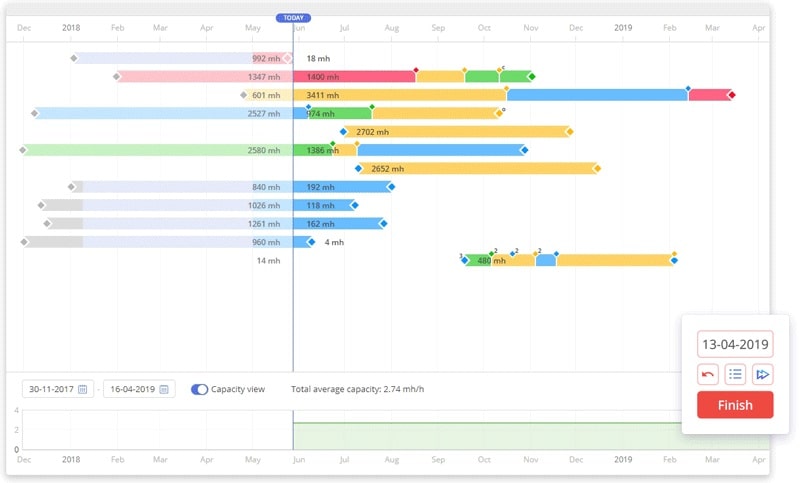
Epicflow is a great tool for business and portfolio management, as well as forecasting. It allows a better overview of your teams’ workload and performance.
Epicflow will make your job easier by helping you prioritize tasks. Data is updated in real time, and you can access it any time. With predictive analytics, you can analyze and predict the success of your business, as well as simulate different scenarios by changing variables and see the consequences.
Epicflow’s key features
Epicflow also provides you with the following options:
- Efficient resource allocation,
- Budgeting,
- Keeping track of amount of work done,
- Resource management,
- What-if analysis,
- Timesheets,
- Task cards and lists,
- Dashboards,
- Gantt Charts, and more.
| Type of plan | Epicflow pricing |
|---|---|
| Free trial | On request |
| Free plan | On request |
| Cheapest paid plan | On request |
#7 Hive — best for visualizing and tracking progress
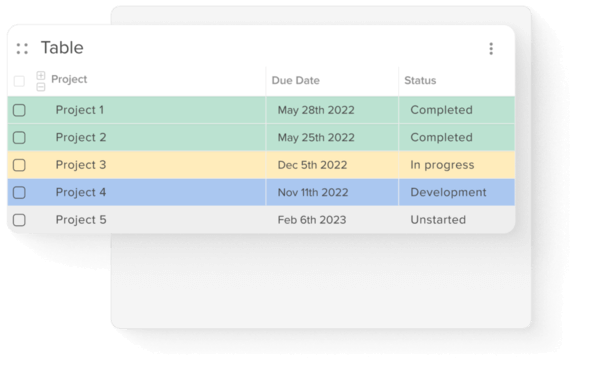
Hive is a project management tool, but it also serves as a forecasting software. It uses AI to forecast how long the projects will last based on the previous work of your team.
With the Hive analytics feature, you can track your team’s productivity and estimate risks, too. This feature will allow you to track projects progress, its due date, and whether it is on track or off track.
Furthermore, you can identify and manage risks with the risk and issue tracker, and the task prioritization feature will enable you to better manage your tasks and assignments. All these Hive features will simplify your workflow and improve forecasting.
Hive’s key features
Hive includes features like:
- Kanban, Gantt, or bird’s eye view,
- Time tracking,
- Calendar,
- Personal To-Do lists,
- Identifying risks with AI,
- Analytics,
- Integrations,
- Color coded tasks, and
- Progress tracking.
| Type of plan | Hive pricing |
|---|---|
| Free trial | Yes |
| Free plan | Yes |
| Cheapest paid plan | $12 permonth/user |
#8 Workday Adaptive Planning — best for large companies
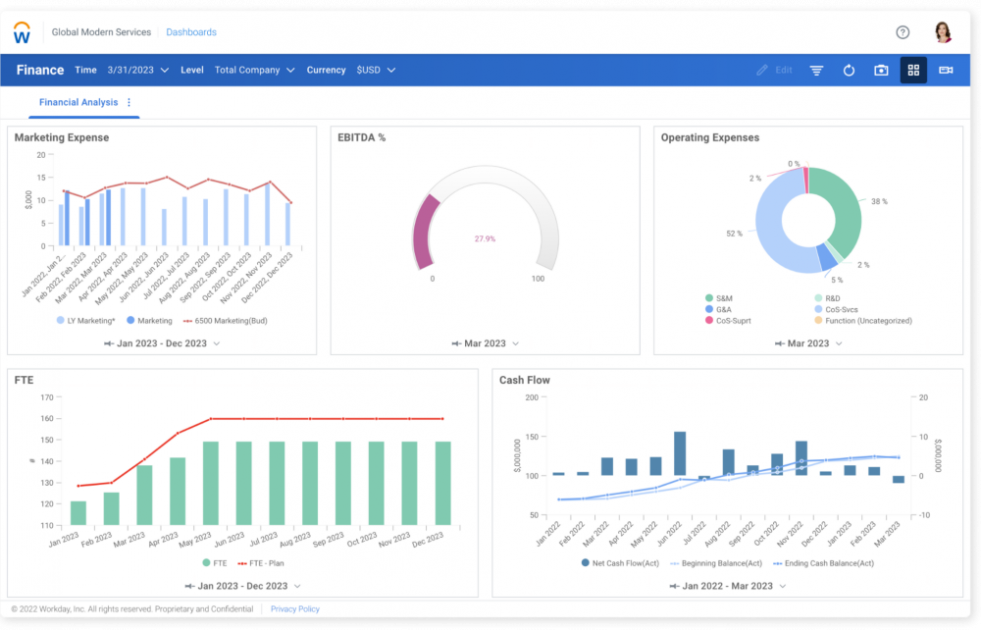
Workday Adaptive Planning is best for large enterprise firms for planning, modeling, forecasting, and budgeting.
It simplifies and improves forecasting by linking data automatically in real-time, so you don’t have to input the data manually. In Workday Adaptive Planning, collaboration between team members is transparent and straightforward, and forecasting is more accurate as everyone is working with the same up-to-date information.
Workday’s key features
Workday Adaptive Planning offers:
- Financial planning that is adaptable and scalable for large corporations,
- Effective business modeling, and
- Reporting that is simple to use.
| Type of plan | Workday pricing |
|---|---|
| Free trial | No |
| Free plan | No |
| Cheapest paid plan | Start around $300K |
#9 Celoxis — best for reports and dashboards
Celoxis is a complete business management solution that will assist you in creating the most accurate forecasts while avoiding risks. It has a beautiful and intuitive user interface which is easy to use.
Celoxis is powered with all necessary features so your team does not have to switch between apps.
Celoxis’ key features
Apart from forecasting, Celoxis offers the following features:
- Gantt charts,
- Advanced scheduling,
- Kanban style,
- Risk management,
- Time tracking,
- Issue tracking,
- Collaboration,
- Resource management, and
- Customizable reporting dashboard.
| Type of plan | Celoxis pricing |
|---|---|
| Free trial | Yes |
| Free plan | No |
| Cheapest paid plan | $22.5 per month/user |
The 7 features to look for in a forecasting tool
With so many forecasting tools available today, most of which claim to be the best, you’re bound to be confused and unsure which one to choose. So, let’s go over all of the essential features that forecasting software should possess while you’re looking for the best one for your company.
Feature #1: Gantt chart view
Gantt chart is a bar chart that gives you a graphic representation of all of your scheduled tasks and activities.
Usually, it consists of a list of activities on the left and a visual representation of those activities (a chart or a time scale) on the right side. So, with a quick glance at a chart, you can have a better insight into tasks and their completion dates.
With Gantt chart you can:
- Set task or project duration,
- Organize and schedule tasks,
- Create notifications and reminders,
- Determine the path of your business,
- Save key information regarding your business,
- Estimate the resources required to complete the project successfully,
- Keep records of milestones, and
- See everybody’s availability at any time.
Feature #2: Analytics and reporting
A good business forecasting tool should enable you to track and analyze your team’s performance. This allows you to see how productive your team is on a project and whether any team members require additional training in certain areas. You will also see how fast they are moving from task to task.
Aside from tracking performance, a quality forecasting software should have detailed reporting, as managers must provide regular updates to clients on an ongoing project. Reporting to clients used to be a difficult task, but it became much simpler with forecasting software.
A great forecasting tool should come with reporting features which include:
- Progress report,
- Time reports,
- Profitability reports,
- Current status of a project,
- Due dates of tasks, to name a few.
Feature #3: Task management
One of the most demanding things a manager may encounter is definitely task delegation. If not done and tracked correctly — forecasts may be wrong and your team may end up delaying the delivery of the final product, resulting in dissatisfied clients.
So, one of the key features that a forecast software should have is task management. Such feature will allow you to:
- Delegate tasks to team members and have a clear overview of who is working on what,
- Monitor the progress of each task,
- Save time by monitoring multiple tasks at the same time,
- Have a transparent team collaboration,
- Have automated reports, and
- Have enhanced team productivity as a result.
Feature #4: Planning and scheduling
If you want to have better forecasting you need a suitable planning and scheduling feature. This will allow you to detect changes in real-time and improve the accuracy of your forecasts.
With the project planning and scheduling feature, you will:
- Schedule employees and know who is available to take over a task or who is fully booked at that moment,
- Have a quick overview of the business structure to help you spot any changes later on,
- Boost productivity by effectively allocating tasks following the plan, and
- Manage time more easily with task scheduling.
When you have a clear picture of your business, precise scheduling, project timelines, and a sustainable plan, your forecasting will be much easier and more accurate.
Feature #5: Time tracking
Time tracking is a significant feature of a forecasting tool, and time management is essential to successful forecasting. Managers must ensure that they allot enough time to each task and that everything runs smoothly.
Furthermore, they must ensure that employees complete their work to the highest quality standards possible, given the time and resources available. When tracking their time efficiently, managers can predict the time they need to complete projects.
With the time tracking feature, you will be able to:
- Plan and forecast more efficiently (thanks to available data through forecasting software),
- Complete work on time,
- Enhance productivity,
- Improve work-life balance,
- Reach your goals faster, and
- Reduce stress and anxiety.
Furthermore, time tracking features in a forecasting tool should include:
- Time reports,
- Task time tracking,
- Personal & shared calendars,
- Daily to-do’s,
- Clock-in/clock-out, and
- Workday settings.
💡Clockify Pro Tip
If you’re having trouble deciding on the best time tracking app, check out our blog post:
Feature #6: Kanban boards
Business managers can use visual models and representations to be more organized and better understand their tasks. Furthermore, different types of visual representations such as graphs, tables, charts, or diagrams help present data more clearly.
When talking about visualizing your data efficiently, what a better way to do that than using Kanban boards!
A Kanban board is a visual depiction of every stage of your projects. It uses cards to represent tasks and assignments, and columns to represent every stage of your plan execution.
With Kanban boards, you and your team can visualize your:
- Planning,
- Assignments, and
- Task tracking.
The Kanban board enables you to divide an adequate amount of workload to each team member while also completing all tasks on time and within specific deadlines.
It is an extremely powerful and useful feature as you will be able to:
- Divide the entire work into smaller and more attainable tasks,
- Adjust workload to your team members and projects, and
- Collect all the important data for your tasks and projects.
Feature #7: Integration with other tools
For successful and quick forecasting, a forecasting tool should have seamless and easy third-party integrations. Usually, efficient forecasting software will allow integration with other apps like:
- Email,
- Google calendar,
- File storage apps,
- Team chat apps,
- Customer relationship management platforms (CRMs),
- Financial and accounting applications, and so on.
When integrating forecasting tools with other software you can:
- Improve productivity and organization of your team,
- Accelerate the work process,
- Reduce risks and mistakes,
- Ensure more accurate data and, consequently,
- Have more precise business forecasting.
Use Clockify to plan and schedule your projects efficiently
As time goes by, business forecasting is becoming an irreplaceable tool in organizations.
With a time management tool like Clockify, you can instantly:
- Get better at financial planning,
- Become more accurate in scheduling, and
- Visualize project progress for teams of any size.
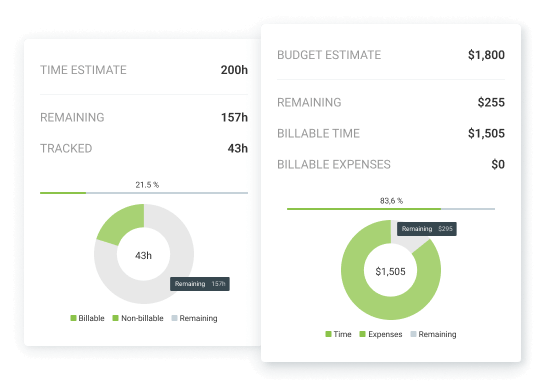
To do all of that and more, first, you need to set budget and time estimates. You simply insert the budget you have planned and the time you think it will take you to complete the project — and Clockify does the rest.
The next step is to see how your team is handling the project.
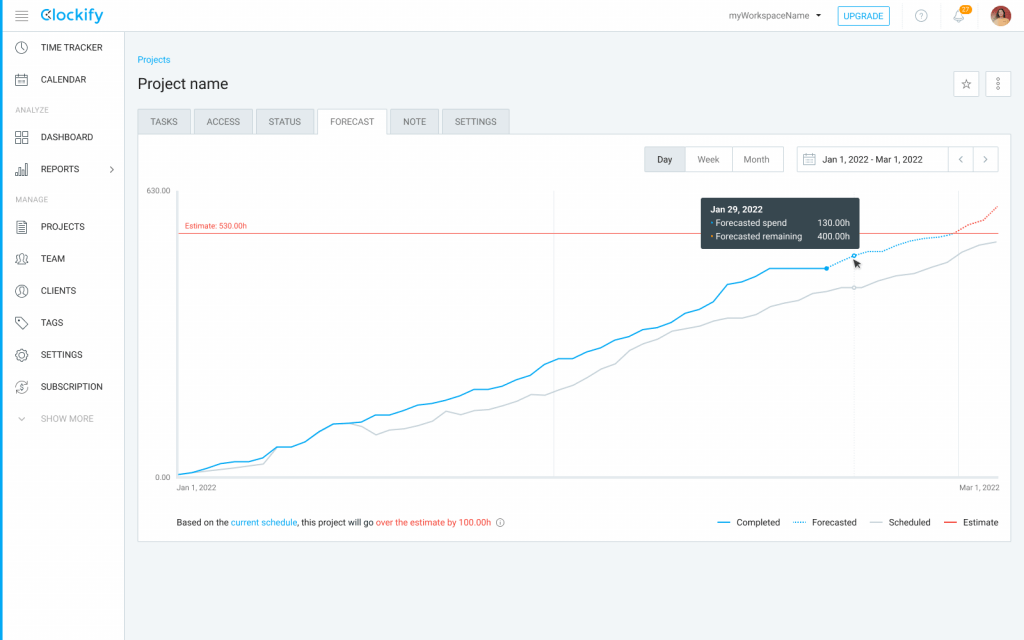
In the example below, you can see 4 lines describing the status of a project:
- Solid blue line (Completed),
- Dotted blue line (Forecasted),
- Solid gray line (Scheduled), and
- Solid gray line or solid red line if the project exceeds the estimation (Estimate).
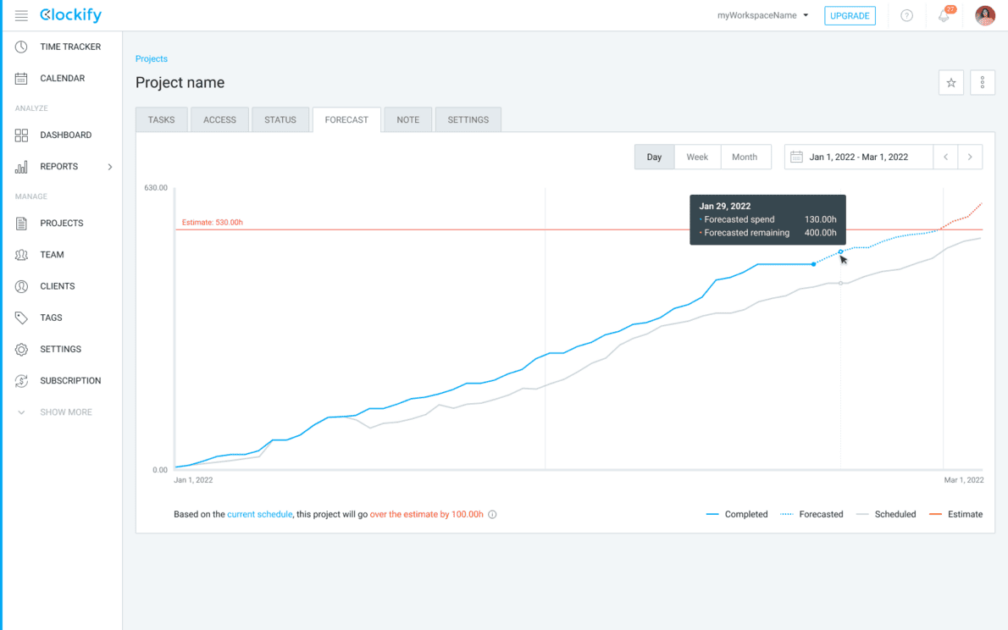
With this tool under your belt, you can easily predict whether future projects will pan out or not.
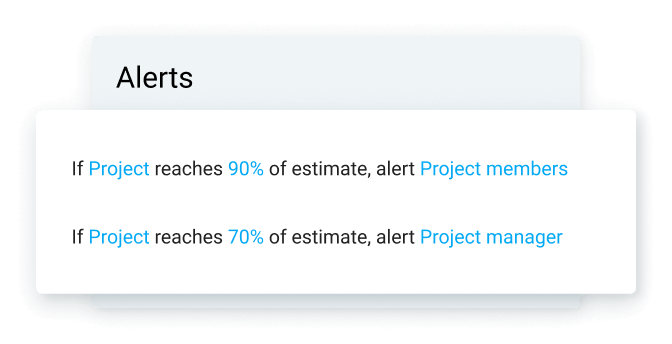
If, for some reason, your project reaches a certain percentage of your estimate, you can choose to receive alerts — or send them to team members. You can also select the criteria under which you and others get alerts, like in the example below:
To run projects and predict the successful completion of tasks, get a piece of project forecasting software that actually does what it’s supposed to do.