PERT Analysis Guide for Paying Projects (+ Free Calculator)
Using a whiteboard to sketch out a project plan is as brittle as building a house of cards — adjust 1 element and everything falls apart.
As you patch things up, you wrestle with scope creep and now unworkable timelines.
Instead, try a data-driven tool that accounts for project risks to provide realistic time estimates — like the PERT analysis calculator. Join us in exploring:
- How PERT analysis works,
- What its pros and cons are, and
- Why you should pick a stronger solution.

What is PERT analysis?
PERT analysis stands for Project Evaluation and Review Technique — a popular project management model that coordinates tasks in complex projects using reliable time estimates. This knowledge helps project managers draft a realistic project plan, which includes:
- All related tasks,
- Task dependencies, and
- Required resources (like duration, workforce, and costs).
Fun fact: The PERT technique was pioneered in the 1950s by the US Navy and the Lockheed Corporation to manage activities related to the Polaris Missile project. Today, it’s used worldwide in industries like:
- Software development,
- Construction,
- Engineering,
- Event planning, etc.
Management consultant Charlene Currie thinks that the PERT analysis supports project management when no historical data is available:

“PERT introduces structure into the estimation process. It forces you to consider the best, most realistic, and worst case scenarios. This helps project managers create a more reliable schedule and anticipate risks earlier.”
Meanwhile, a PERT calculator uses the PERT analysis framework to help you avoid project pitfalls — like cost overruns — and improve on-time delivery.
Alternatively, you can count on cutting-edge time trackers like Clockify to:
- Get more granular data,
- Manage unpredictable schedules, and
- Forecast project management timelines.
How the PERT analysis calculator works
The PERT calculator helps you track projects and tasks from start to finish using:
- PERT analysis, and
- Standard deviation.

⬇️ Get Free PERT Analysis Calculator (Google Sheets)
Now, let’s dive into the calculator’s mechanisms, together with examples.
PERT analysis formula (+ example)
The PERT analysis formula (or time estimation formula) determines the likeliest time for project completion based on 3 time estimates, such as:
- Optimistic time estimate (O) — best possible outcome with uninterrupted operations and strong profitability,
- Most likely time estimate (M) — most probable outcome in a typical work setting, and
- Pessimistic time estimate (P) — worst possible outcome with delays, cost overruns, and other setbacks.
Here's how the PERT technique formula looks:
PERT analysis example: Say you want to launch a software product. Based on your experience and consultations, you’ll set the 3 time estimates and apply the PERT analysis formula below.

So, you can expect to finish your project within 182 days. But how sure can you be about your projected timeline? That’s what standard deviation can tell us — up next.
Standard deviation formula
Standard deviation shows the probability of completing a project on time. To get this value, the PERT calculator applies the following formula:
Standard deviation example: As established, you’re planning to launch a software product within 180 days. Let’s apply the above formula to assess how likely that is.

So, the actual completion time may be about 22 days earlier or later than the 182-day estimate. The lower your standard deviation, the more confident you can be in meeting your expected due date.
Misjudging the project schedule can poke holes in your pocket, leading to faulty project quotes and undercharging. With the PERT analysis calculator, project managers can create a reliable project plan and stay within time and budget limits.
🎓 Afraid of Undercharging? Here’s How to Bill Clients Accurately
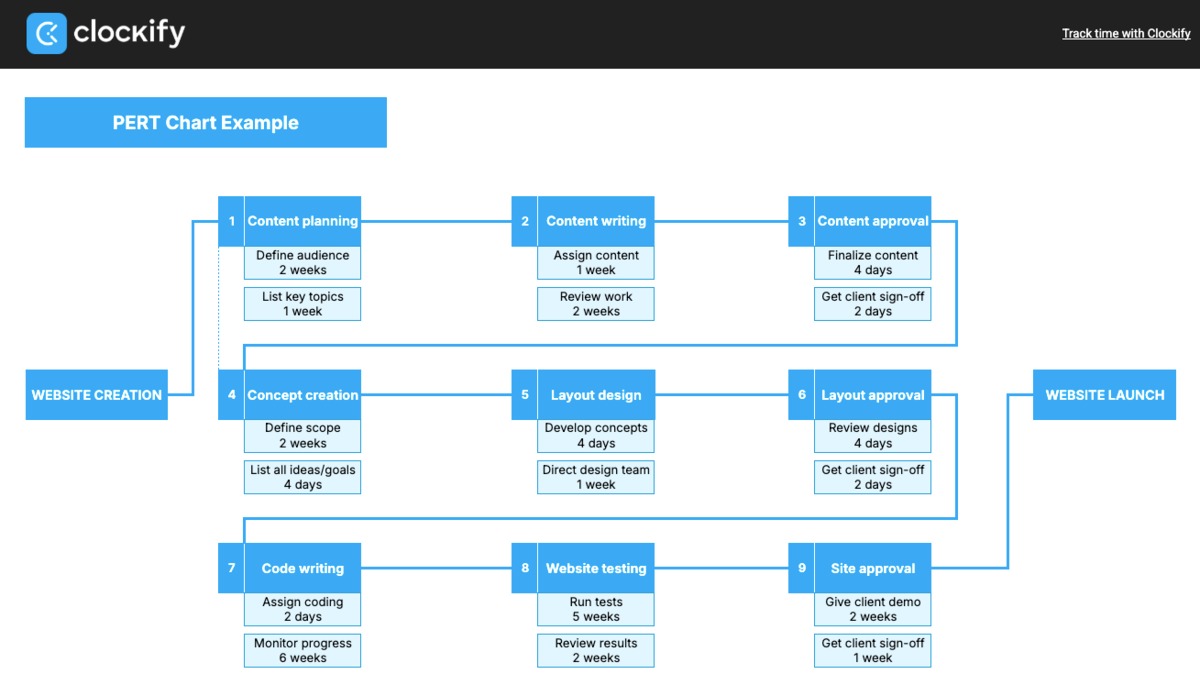
Use PERT charts to create meticulous project plans
Once you master our PERT analysis calculator, you can create a PERT chart — an illustration of your project’s life cycle. It breaks down your project into nodes (or milestones) and tasks, highlighting any dependencies.
To demonstrate, see our PERT chart template below.

⬇️ Get the PERT Chart Template (Google Sheets)
To properly implement our PERT chart template, take the following steps:
- Name your project (e.g., Website creation),
- Define the milestones (e.g., Layout design),
- Add the related tasks (e.g., Develop concepts),
- Use our PERT analysis calculator to get their expected duration, and
- Sum up task durations to get the project’s estimated completion time.
Here’s how to fill in our PERT chart for website development:
Optional: You can calculate the standard deviation for each task using our PERT calculator. This offers a more accurate guess about the project’s timespan, helping you:
- Justify timelines to clients and stakeholders, and
Ultimately, PERT charts are tools that enhance planning and execution. This makes them invaluable in agile project management, where open communication, flexibility, and efficiency are paramount.
PERT chart vs. other project management tools
The PERT chart and other statistical tools are used for project planning, but they’re visually and practically distinctive. Let’s discover how.
Quick reminder: No project management practice or tool is better than the other. Instead, your ideal approach will depend on the nature of your projects.
PERT vs. CPM
The Critical Path Method (CPM), also called the Critical Path Analysis, identifies the critical path, or the longest route through essential tasks to get the minimum project length.
So, the 2 models differ in perspective. While CPM manages predictable tasks, the PERT analysis focuses on unpredictable tasks.
Still, managers and consultants can use either method for delay impact assessment. In other words, both techniques help you understand how delays can throw projects off course. CPM shows which tasks may cause the longest delays, while PERT reveals the risk of task delays.
PERT vs. Gantt
Forbes compares PERT and Gantt charts, noting that:
- PERT chart shows task correlations with a flow chart, while
- Gantt chart displays a project’s timeline on a horizontal calendar.

That’s why PERT charts are perfect for project uncertainty management — addressing project risks and ensuring the best outcomes. On the other hand, Gantt charts help you visualize schedules, making them great for tracking project progress.
Bonus tip: For more nuanced results, combine our PERT analysis calculator with other models (like the Gantt chart). To get started, try a simple project management software like Plaky to create schedules with the Gantt view.

Clockify and Plaky, along with the Pumble team chat app, are part of the CAKE.com Bundle, which offers these 3 productivity tools at a heavily discounted price of $12.99. This way, you’ll manage your projects, your time, and overall communication with ease.

PERT vs. WBS
The International Society of Six Sigma Professionals (ISSSP) explores the benefits of combining PERT and WBS (Work Breakdown Structure), explaining that:
- WBS splits projects into smaller, feasible tasks with specific durations, and
- PERT uses the data to schedule and display tasks on a visual canvas.
By creating a WBS and a PERT chart, a Six Sigma project team can map all tasks, understand their interdependencies, and identify the critical path.
Advantages of the PERT analysis
Why should you use the PERT analysis for project planning? Besides timely project delivery, here are some compelling pros.
PERT pro #1: Enhanced long–term planning
The PERT chart lets you identify the logical order of project-related tasks and project length — which is especially practical for ongoing projects. You end up with a structured project management timeline that fosters accountability among employees.
🎓 Short-Term and Long-Term Planning: The Smart Team’s Strategy
PERT pro #2: Effective scope management
The PERT diagram represents a project’s shortest possible completion time. By anticipating time and, therefore, costs, you can prevent scope creep.
In fact, a study on assessing project performance found that PERT lets you schedule projects and define budgets in advance, keeping actual work under control.
What’s more, the chart helps you spot constraints and bottlenecks, which lowers the risk of overspending or pushing deadlines.
PERT pro #3: Better client relationships
You can justify project timelines to stakeholders with a straightforward, visual chart — ensuring smooth communication.
In fact, Tom Molnar, operations manager at a web design agency, thinks that PERT charts encourage client trust, which helps teams handle stress better:

“Clients value the presentation of the timeline's logic and the team is under less pressure when their widths of risk are made clear.”
Disadvantages of the PERT analysis
Pros aside, what are the cons of the 3-point estimating technique? Explore our list below.
PERT con #1: Unsuitability for repeat projects
According to management consultant Charlene Currie, using the PERT analysis for well-documented, recurring projects is a pure time waster:
“PERT can become an unnecessary effort when a project is repeatable or when strong historical data already exists.”
PERT con #2: Required training
A recent article on the PERT technique suggests that a project schedule created with this method is only as effective as your experience in applying it.
That said, project manager and consultant Ruth Philips stresses the need for skill development when working with PERT:

“PERT requires discipline in collecting input data, and not every organisation is mature enough to provide quality estimates.”
PERT con #3: Complex process
Founder of a product development company, Lexi Petersen, notes that applying PERT to each task to get the project duration can cost time and money:

“The first time we tried to schedule an influencer-driven launch, we broke it down into 30+ microtasks and spent days trying to estimate timelines.”
Moreover, the smallest project changes — like adding another task or assignee — will require you to update the PERT diagram.
🎓 Best Time Management Apps in 2026: Top 11 Picks
Top 3 PERT challenges (and best solutions)
Even though the PERT analysis helps you anticipate project uncertainties, unforeseen issues can still happen. Here are project managers’ most common challenges and best solutions.
PERT challenge #1: Project delays
The PERT analysis relies on subjective estimates, which can sometimes result in deadline extensions. In fact, a 2025 study on PERT vs. CPM analyzed 26 related publications and listed PERT’s main limitations:
- Fragile assumptions (15.38%), and
- Mismanagement of uncertainty (11.54%).
Solution: To combat schedule delays, try a project management technique called fast-tracking — working on certain tasks in parallel.
When identifying tasks for fast-tracking, make sure they don’t completely depend on each other. Hence, if you can’t start work on task A before task B is done, those aren’t good candidates.
PERT challenge #2: Mid-project adjustments
Mid-project changes are a day-to-day reality, which can disrupt project flow. To get back on track, you need a practical view of all impacted resources — including staff capacity and task deadlines.
Solution: Use Clockify’s calendar to see employee schedules over the week — with details like:
- Scheduled assignments,
- Project activity, and
- Task overlaps.
That way, you can easily check if your changes (like extended tasks) overlap with any other activity and compromise your project due date.
PERT challenge #3: Justifying timelines to clients
Projects planned with the PERT analysis can be completed later than expected, as well as earlier — all this impacts:
- Employee schedules,
- Project billability, and
- Client transparency.
Director at a construction company, John Kirton, expands on the risks of early task execution in the building business:

“Having supplies delivered too early can mean physical space needs to be allocated on site, damage to materials can occur, and costs have been created earlier than necessary.”
Solution: Let clients in on your project plan within an effective time tracker like Clockify to improve client trust.
For instance, visit the CAKE.com Marketplace and install the FeatValue add-on to connect the client portal with Clockify. Once synced, clients can use FeatValue to:
- Add tasks that show up in Clockify,
- Observe the task status, and
- Check Clockify time entries.
FAQs about PERT analysis
Read up on the most common PERT questions and our full answers.
Is CPM easier to understand than PERT?
In comparing CPM and PERT, CPM appears simpler because it uses 1 fixed time estimate to create a project’s critical path. However, its results are derived from past projects.
On the flip side, PERT uses 3 time estimates to offer the most likely project completion time without access to historical data.
Since both tools are closely related in purpose — project planning and completion — neither is easier to understand. Instead, they help you thrive in different situations.
CPM is better suited for repetitive projects, while PERT is ideal for uncertain, non-repetitive work.
🎓 How to Break a Project Down into Tasks
How do you use PERT in agile?
According to agile methodology, predictable projects are every manager’s pipe dream. So, agile practices can’t rely on deterministic estimation, but can use a probabilistic model like PERT to forecast outcomes.
After all, agile teams are all about adjusting to changing circumstances, and PERT can steer their work with potential — not fixed — estimates.
Run lean and lucrative projects with Clockify
The PERT analysis calculator offers rational project estimates. But what if you could raise the accuracy bar to near perfection? With a time-tracking app like Clockify by CAKE.com, you can streamline projects using abundant data and advanced analytics.
Our simple yet impactful time tracker ensures effective resource planning and project delivery — with flexible features.
#1: Define time and budget estimates
For each project in Clockify, allocate a set number of hours as follows:

Also, you can include billable expenses in your project budget like this:

Nifty fact: You can switch currencies and even assign different currencies to different clients before invoicing.
#2: Monitor project status
Our no-nonsense app lets you compare real-time project progress with the estimated time and budget. That way, you can make confident decisions about any changes.

Heads up: If you already have historical data on past projects, use project forecasting in Clockify to make more precise estimates.

#3: Export and share project reports
Save custom project reports for safekeeping and deeper analysis outside Clockify. Alternatively, you can share data with clients to maintain trust.

To compare projects, get in-depth insights on billable and non-billable time per project over a custom time range.
If you have any questions or concerns, our affordable timekeeping tool boasts a full human support team. Just drop them a line and expect quick replies.
Start breaking records in project estimation — powered by Clockify.
REFERENCES
License for research — https://creativecommons.org/licenses/by/4.0/
- Analysis and Evaluation of (β) Beta Distribution or Three Point Estimation for PERT Technique in Project Management
License for research — https://creativecommons.org/licenses/by-sa/4.0/
- The role of time and cost control in CPM, PERT, and EVA methods in construction projects: A meta-analysis study on evaluating project performance
License for research — https://creativecommons.org/licenses/by-nc-nd/4.0/
- PERT and CPM in Construction: Analysis of Benefits, Limitations, and Future Trends