Productivity tracker
Clockify is a productivity tracking app that lets you identify where you spend time so you can better manage it.

![]()


What is Clockify? (11:05)

What is a productivity tracking app?
Clockify is software that lets you organize your daily tasks by projects and track the time it takes you to complete them.
- Track time using a timer across platforms, or enter it manually
- See tracked time in Calendar and compare it with events in Google or Outlook calendar
- Record apps and websites you use with auto tracker
- Add team members and check their progress on tasks
- See where you time goes in reports
How to track productivity with Clockify
Download time tracker app
Download a time tracking app and track across all platforms — all your data is synced online.

Start the timer
When you start working, start the timer with one click. Alternatively, you can input time manually after the fact.
Categorize time
You can categorize time entries by project and tag in order to analyze them and explore how you can be more productive.
Analyze time
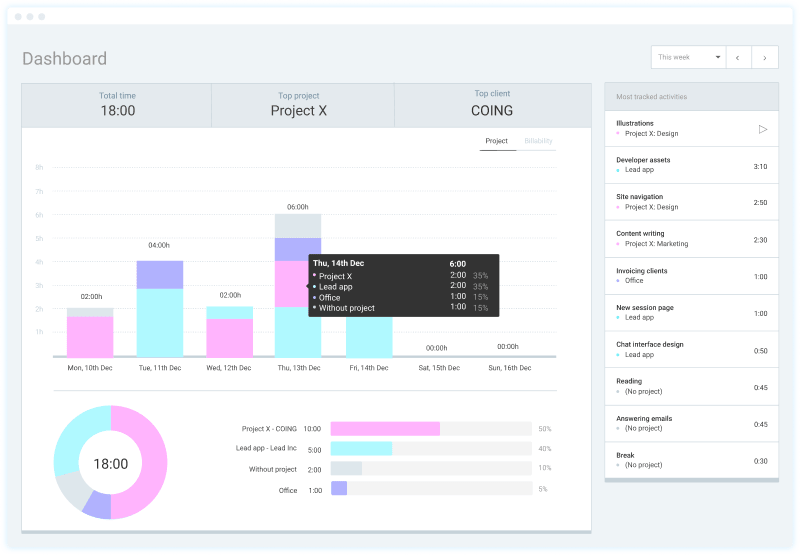
Open the Dashboard to see your most tracked activities and where you spend the most time.
Continue the timer with one click
If you're constantly juggling between tasks, you can always pause an activity, start tracking time for a new one, and then come back and continue the timer.
Enable auto tracker
Clockify can track what apps and websites you use so you can later create time entries based on time spent in other apps, either one by one or in bulk (data is visible only to you).
Track time inside other apps
Install Chrome, Firefox or Edge extensions and a timer button will appear in your favorite web apps so you and your team can track time more easily.
Clockify can be integrated with over 80 project and task management tools, such as Trello, Asana, Todoist, Gmail, Google Calendar, Google Docs, etc.
Enable productivity features
- Pomodoro timer: Work in time blocks with breaks.
- Reminders: Receive a notification when you forget to start the timer.
- Idle detection: Discard inactive time that you've spent away from the computer.
Productivity guides
Time management tips →
List of tips for better time management.
Time management techniques →
List of 19 best techniques for improving productivity.
Freelance productivity guide →
Time management and organizing tips for freelancers.