10 Types of Forecasting Models
Are you constantly wondering how your product will do — and whether your business will thrive or fail?
Believe it or not, you don’t have to go to a psychic to predict the future. You just need the right forecasting model.
Here are 10 types of forecasting models that will help you optimize resources and maximize profits.

| Forecasting model | Method | Definition |
| Straight-line method | Quantitative method | A forecasting model that uses past data and trends to estimate future revenues. |
| Moving-average model | Quantitative method | To predict future values, this forecasting model calculates a series of averages, such as annual revenues for the past 3 years. |
| Exponential smoothing | Quantitative method | A forecasting model that combines the past forecast and the percentage of value — the difference between the current and past forecasts. More recent values have more weight than older observations. |
| Trend projection model | Quantitative method | This forecasting model analyzes past events to determine patterns and recurring trends. |
| Simple linear regression | Quantitative method | A forecasting model that takes one variable — such as money invested in ads — that influences what you’re trying to predict. |
| Multiple linear regression | Quantitative method | This forecasting model takes more than 1 variable that influences the outcome you’d like to predict. There is 1 dependent variable (forecasted value) and 2 or more independent variables. |
| Delphi method | Qualitative method | A forecasting model that combines a group of relevant experts (who give their opinions on a problem) with market orientation. |
| Market research | Qualitative method | By interviewing potential customers, this forecasting model evaluates the performance of products and services. |
| Panel consensus | Qualitative method | A forecasting model that gathers experts or employees to discuss a product or a service. |
| Sales force composite | Qualitative method | To estimate future sales for a given region and time period, this forecasting model uses sales staff input. |
What is financial forecasting?
Financial forecasting means making projections about a company’s future performance. It allows you to estimate how current trends and business metrics will affect the financial position of your business.
To do this, you need to explore historical information on:
- Business performance (sales, revenue, or expense figures),
- Current business trends, and
- Other business variables.
If you don’t make any predictions, you risk unexpected cost overruns that can delay projects and disrupt future revenue.
Forecasts help you see if you need to fund a specific project, expand your team, or adjust the annual budget. As a manager, you can use forecasting to:
- Set goals and plans ahead of time — analyzing data and statistics helps businesses better evaluate their progress and adapt business operations accordingly.
- Allocate the business budget — a forecast will give you estimates about the revenue expected in a future period. This gives you insight into where to allocate the budget.
- Predict market changes — projections help companies adjust their strategies and improve operations to meet current market trends. This could help you stand out from the competition.
🎓 What is Forecasting in Project Management? Basics Explained
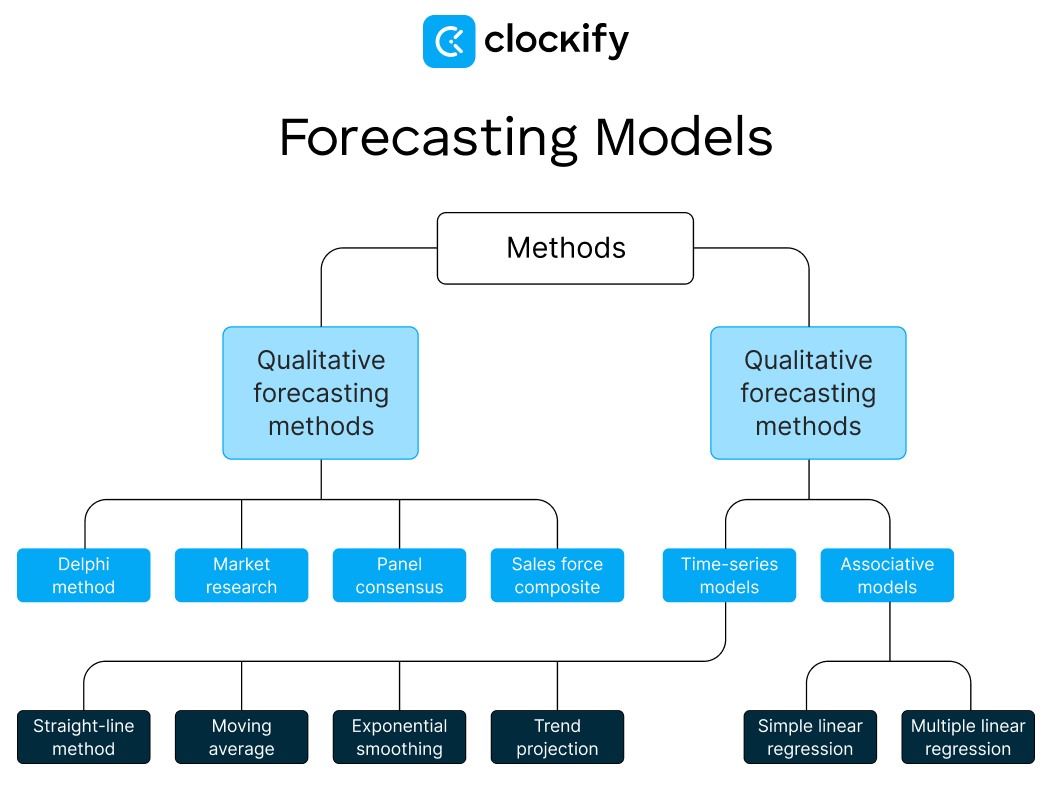
The 2 main forecasting methods include:
- Quantitative forecasting method, and
- Qualitative forecasting method.
Now, let's take a look at these types of forecasting models in more detail.
Quantitative forecasting models
Quantitative methods implement available data to calculate results — they don’t rely on opinion, emotion, or intuition. These methods are usually used to make short-term predictions by analyzing older, raw data.
Quantitative methods can be further divided into:
- Time-series forecasting models, and
- Associative (causal) models.
Let’s take a closer look at the different types of quantitative forecasting models.
#1: Time-series forecasting models
Time series is a popular forecasting model that analyzes past company behavior to predict future behavior (e.g., consumer or sales behavior). This forecasting model uses historical data spanning hours, weeks, months, and years to make predictions.
The subtypes below are all examples of time-series forecasting models:
- Straight-line method,
- Moving average model,
- Exponential smoothing model, and
- Trend projection model.
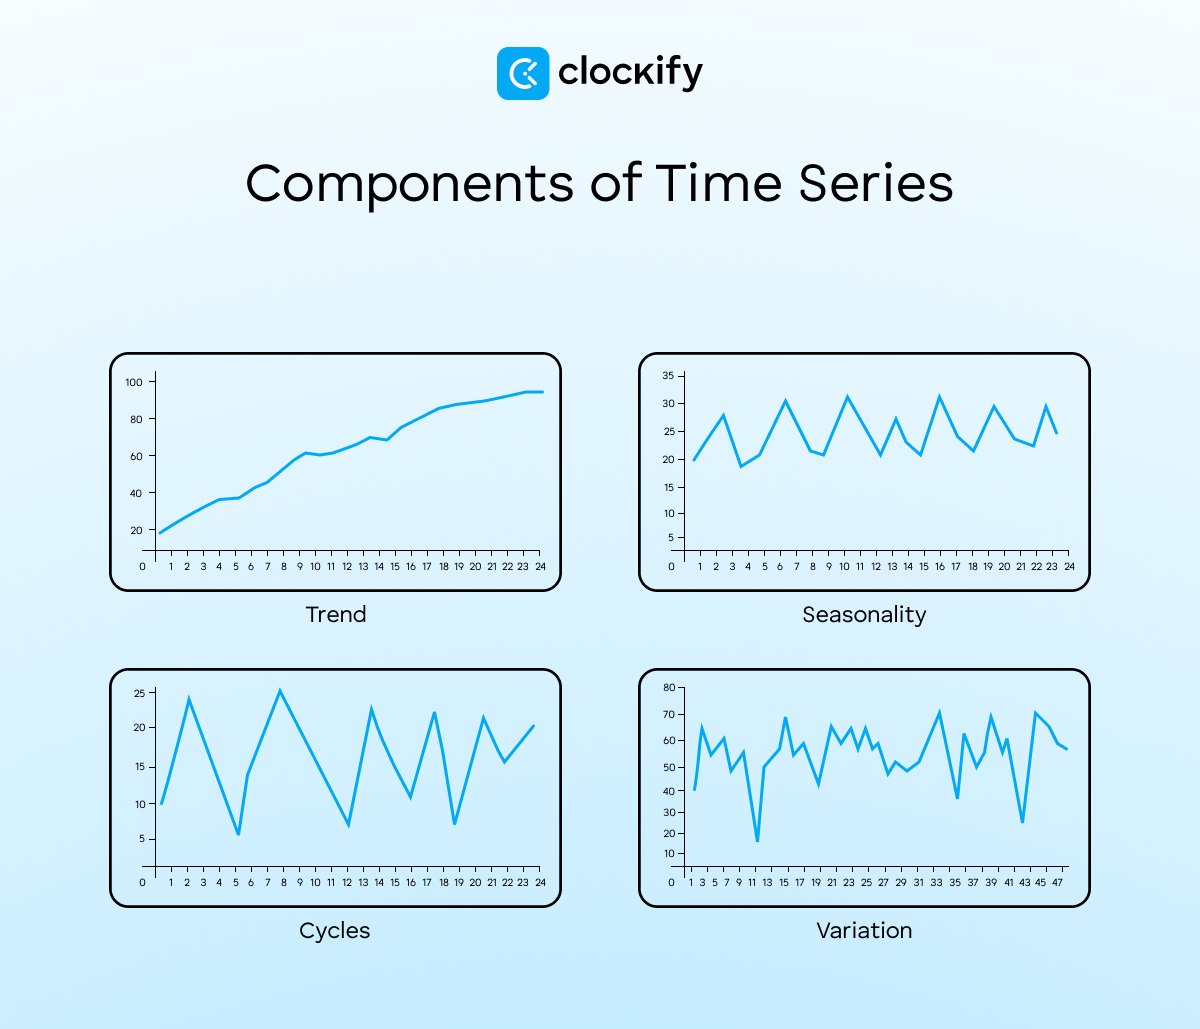
Each time-series subtype has at least one of these 4 components:
- Trend — tendency to grow or decline,
- Seasonality — the interval at which a pattern repeats, usually the same month(s) every year,
- Cycles — varying intervals at which a pattern repeats; data rises and falls without a fixed frequency, and
- Variation — deviation from usual patterns that appear to be random.
Straight-line method
The straight-line method can estimate future revenues based on past data and trends. It assumes the growth rate will stay the same as in the previous periods.
To use this model, first find the growth rate of sales.
Let’s say the annual growth rate of a company has been a fixed 6% over the past 5 years. The company anticipates growth of 6% over the next couple of years. Using this information, the company can predict future sales.
This way, you get to estimate future project budgets more accurately, minimizing the risk of cost overruns. However, keep in mind that this method doesn't account for any factors that could influence the growth rate (e.g., product release delays). It relies solely on historical data.
So, if you’ve had a steady growth rate for years with no foreseeable change — this method is helpful for calculating future revenue.
Moving-average model
The moving-average model calculates a series of averages (e.g., annual revenue for the past 5 years) to predict future values. It also accounts for the margin of error.
Depending on how many months the model uses for averaging, there are 2-month, 3-month, 4-month averages, and so on. Instead of months, it could be days, years, or another defined time period.
Here’s how you can do the calculations to get the moving average:
Let’s say you want to calculate the moving average of sales figures for a period of 4 years (2021–2024). You decide to do a 2-year moving average (i.e., taking 2 years at a time), using the following data:
| Year | Sales ($M) |
| 2021 | 4 |
| 2022 | 7 |
| 2023 | 6 |
| 2024 | 5 |
You would need to find averages for the following data subsets: 2021–2022, 2022–2023, and 2023–2024. To calculate the averages, simply sum up the values and divide them by the number of values you have, like this:
Then, you would calculate errors. Having calculated the average for 2021 and 2022, you have a forecast for 2023. Since you already have actual data for 2023, you can compare it to your forecasted value for that same year to get the error percentage.
So, instead of using simple averages, the moving-average model allows you to calculate errors. Thus, you can use that data to make more accurate forecasts.
To calculate future revenue using a 3-month moving average, you would take the average of the first 3 months to forecast month 4. Then, it would skip the first month and take the average of the second, third, and fourth months to get the value for the fifth month.
This process repeats until the average of the final months for which you have data is calculated. Then, compare the forecasted and actual values to calculate the error percentage.
Finally, you can calculate the average for the upcoming year you actually want to predict, taking into account the error margin.
Exponential smoothing method
The exponential smoothing method predicts new values as weighted averages of past observations.
New forecasts are derived by combining the past forecast and the percentage of value (the difference between the current and past forecasts). The idea behind this model is to give more weight to more recent values in the series — as observations get older, past values become exponentially smaller.
The smoothing constant is a value between 0 and 1. You can test different values to determine the optimal smoothing constant:
- A lower value (e.g., 0.2) is used to give more weight to previous data.
- A higher value (e.g., 0.7) gives greater weight to recent observations.
This model is suitable for situations where you can’t identify a clear trend or seasonal pattern.
CEO of a fuel delivery company, Eliot Vancil, says he can’t rely on past trends because fuel usage doesn’t follow typical patterns. That’s why he believes exponential smoothing works best for his business:

“Exponential smoothing allows me to react to new data as soon as it is available and prevents old data from influencing the next decision. My planners update their inputs every 4 hours, which results in a demand curve being produced by the model that represents the actions taken by both the crew and fleet managers.”
While exponential smoothing brings many advantages, Eliot also finds that it’s not always as accurate as he needs it to be:
“The model's greatest advantage is its ability to provide a quick response, and its disadvantage is its sensitivity to outliers. When an outlier occurs, it can cause the model to shift significantly beyond what it would normally reflect.”
As expected, Eliot says this requires a team to review the data in real time.
Trend projection model
The trend projection model examines past events to identify patterns and recurring trends.
Trend projection can be used to forecast future activity because it assumes that all factors involved in past trends will continue. The model requires long, reliable time-series data, arranged in chronological order for evaluation.
By identifying trend patterns, the company will be able to gain a vision of the future. As a result, once you identify the trend, you can forecast demand.
#2: Associative (causal) forecasting models
Associative models are an advanced way to forecast sales because they use specific mathematical calculations to identify the relationships between variables that can affect your business activity.
The subtypes of causal models include:
- Simple linear regression model, and
- Multiple linear regression model.
Linear models assume there’s a linear relationship between the dependent and independent variables. In fact, this relationship can be positive or negative.
For example, let’s say your sales (dependent variable) increase when you invest more in advertising (independent variable). That’s a positive slope that indicates an upward trend. The negative slope would be the exact opposite — your independent variable causes a decrease in the dependent variable.

Simple linear regression model
The simple linear regression model involves taking one factor you think influences what you’re trying to predict. For example, you can use this model to examine the relationship between money invested in ads and product sales.
Here’s the formula for calculating simple linear regression:
So, in this case, your dependent variable (Y) would be the future sales you’re trying to predict. Ad investment would be your independent variable (X).
Multiple linear regression model
As its name suggests, the multiple linear regression model follows a similar approach to the simple linear regression model.
The only difference is that this model is suitable when you have more than one variable influencing the business outcome you want to predict. This means you’ll have 1 dependent variable (forecasted value) and 2 or more independent variables.
However, performing multiple regression by hand can be difficult, as these models are complex — especially when there are too many variables. So, you’ll likely need statistical software.
🎓 8 Best Business Forecasting Software in 2025
Qualitative forecasting models
Qualitative methods are subjective in nature and rely largely on:
- Judgments,
- Expert opinions,
- Intuition,
- Emotions, or
- Personal experiences.
These types of forecasting methods don’t involve any mathematical calculations. They are mainly used when the historical data is too narrow or not expected to be followed in the future.
Now, let’s explore some subtypes of qualitative forecasting models.
#1: Delphi method
The Delphi method is a forecasting model that involves a small group of relevant experts who voice their opinions on a given problem or situation. The expert opinions are then combined with market orientation to yield results and develop an accurate forecast.
Forecasting using the Delphi method typically goes like this:
- You decide who the facilitator will be — you or another neutral party,
- The facilitator chooses experts in the field,
- The facilitator (with or without the help of a researcher) creates a questionnaire,
- The experts fill out the questionnaire,
- The facilitator reviews the results,
- The facilitator creates a second questionnaire,
- The participants review the results of the first questionnaire and fill out the second, and
- The process of reviewing results and filling out questionnaires is repeated until consensus is reached or it’s determined that the experts can’t agree on the topic.
Some of the highlights of this model include:
- Freedom of expression — since each expert is questioned individually, they have the freedom to express their own opinion without feeling peer pressure.
- Ability to make up their mind and give a second thought — the experts can change their opinion and provide additional information in case they have reassessed the problem.
- Consistent feedback — after each round, participants are informed of other group members’ opinions, allowing them to consider alternative viewpoints.
- Quantitative results — this type of model is qualitative in nature; however, there’s a possibility to analyze the results quantitatively.
The Delphi method can be used to predict sales trends, forecast economic development outcomes, identify risks and opportunities, and improve workflows.
#2: Market research model
The market research model evaluates the performance of products and services by interviewing potential customers. Their reactions and responses are recorded — and then analyzed to produce a sales forecast.
This model can be performed by staff members or third-party agencies (specialized in market research) by:
- Telephone,
- Opinion poll,
- Personal interviews, or
- Questionnaires.
Some examples of market research strategies include focus groups, consumer surveys, and product testing. These techniques are used to gather valuable insights from consumers so the company understands which products or services to continue launching and which to revise.
The market research model can help companies:
- Estimate the market size,
- Create consumer-oriented marketing policies,
- Study marketing problems to come up with a solution,
- Minimize the gap between consumers and manufacturers,
- Introduce new products,
- Identify potential markets,
- Find the reason behind the decline in sales, and
- Choose marketing methodologies.
The market research model can be used:
- Before the launch of a new product or service,
- Once a product or service has been launched, to find out if it’s been accepted, or
- As a continuous plan that will help businesses get information about their market standing.
#3: Panel consensus model
The panel consensus model (also called expert opinion) is an approach in which experts or employees from all levels of an organization discuss a product or service. The members act like a focus group, expressing their thoughts and recommendations to develop a forecast.
The forecasting process involves a high number of participants. Therefore, the outcome would be more balanced and reliable than an individual’s opinion. The meeting ends once a consensus is reached.
Some of the highlights of the panel consensus model include the following:
- Members from all levels within an organization can establish the forecast,
- A large number of ideas can be presented based on each individual’s knowledge, and
- A further panel of 5 top managers is required to reach a final decision.
The panel consensus model is useful when there isn’t enough data relevant for forecasting, short-term projections, or department-specific forecasts.
Other examples where panel consensus may be appropriate are when companies need to:
- Identify which products are being returned most often and why,
- Get insights into what customers are looking for,
- Detect new trends at an early stage, or
- Forecast new product sales in the market.
#4: Sales force composite model
The sales force composite model uses sales staff input to estimate future sales. When estimating future demand, the company may decide to collect information from the salesperson. This person helps determine customers’ needs and predict sales for a given region and time period.
With the sales force composite model, sales agents better understand customer needs because they interact with them regularly. This information helps in adjusting business operations to meet the client’s needs and maximize sales.
The salesperson is questioned about customers’ experience and satisfaction with the company. This model is easy to conduct, since it only requires an appointment with sales experts. Each person gives their own opinion about what they expect to sell in their specific region.
The sales force composite model can be useful when you need to:
- Make shorter-range forecasts for more accurate sales estimates,
- Get an opinion on sales trends,
- Have more accurate insights based on the experience of sales staff,
- Estimate the sales of new products, promotions, or strategies, or
- Predict the future market conditions.
FAQs about forecasting models
To learn more about forecasting models, read the answers to some of the most frequently asked questions.
How to choose the right forecasting techniques?
When selecting a forecasting model, you should consider:
- Relevance and availability of relevant data (e.g., past sales, past revenue, time worked),
- Degree of accuracy required,
- Time period available for analysis, and
- Costs or benefits of the forecast to the company.
However, before selecting the model, also consider the forecast’s purpose and which variables to include. This will help you choose the right model to manage projects effectively — such as making accurate budget estimates and project timelines.
🎓 Project Management: 31 Best Techniques, Practices, and Tools
What types of forecasting models are used in supply-chain management?
Both quantitative and qualitative forecasting models can be used in supply-chain management. Examples of quantitative models suitable in this case include exponential smoothing and moving average. When it comes to qualitative methods, you can rely on the Delphi method, market research, and panel consensus.
What is the best tool for forecasting?
The best tool for forecasting is the one that yields the best results for your business with the least amount of effort on your part. This, of course, depends on the kind of forecasting you need. For example, Clockify by CAKE.com is a simple and effective solution if you need to forecast how much time it would take your team to complete a project.
Forget complex formulas — forecast with Clockify by CAKE.com
Even the best forecasting models have their flaws and can be complex to implement on their own. What’s more, if you rely on your own calculations without dedicated software, you don’t get real-time data about current and future budgets.
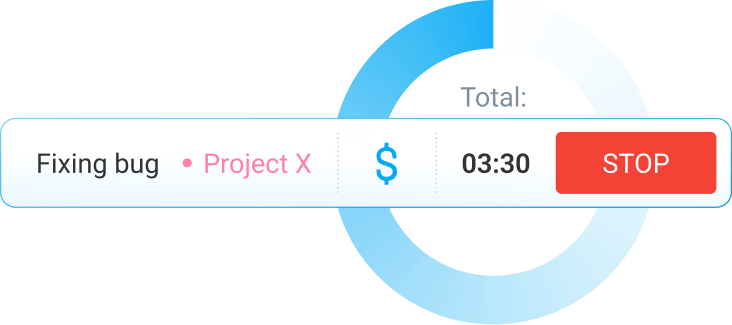
That’s why powerful time trackers with forecasting features are a lifesaver. A simple app like Clockify helps you get a better understanding of how your project is performing.
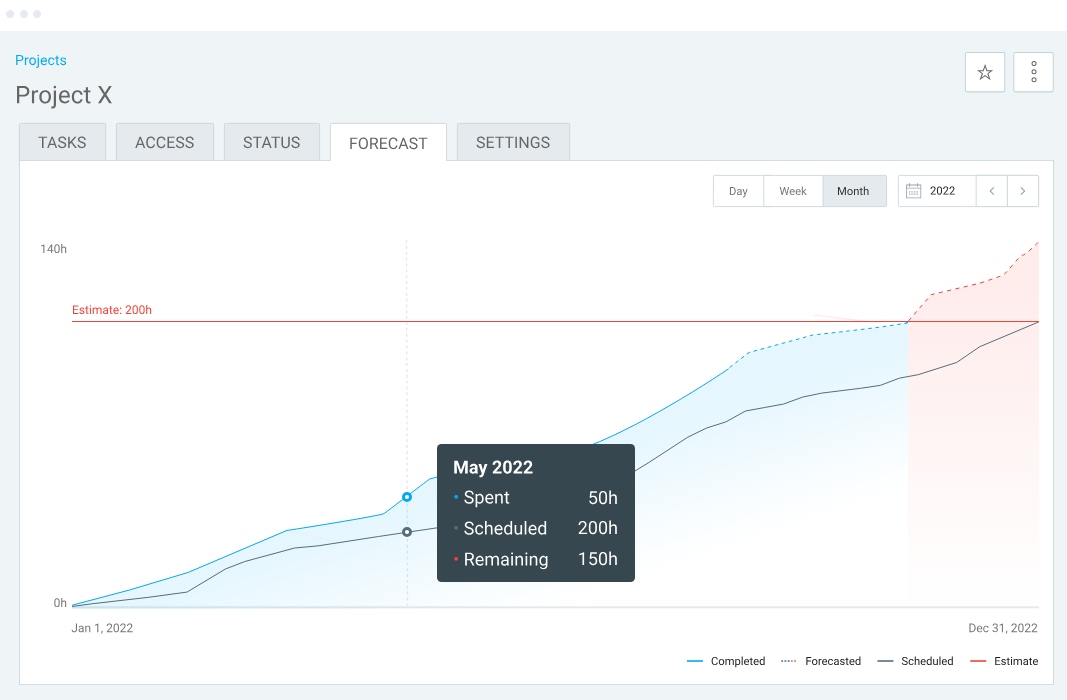
Namely, when you track billable and non-billable hours on tasks in Clockify, the app can predict how much time and money will be spent on the project.
If your billable hour estimations are off — you risk undercharging your clients.
Luckily, Clockify alerts you when tracked billable hours are getting close to your estimates. For example, you can choose to be alerted when your team tracks 70% (or any other percentage) of your estimated billable time.
This way, you can predict potential time or cost overruns and implement preventive measures.

References:
*Licence for research: Creative Commons Attribution License (CC BY)
Alaze A., Finne E., Razum O., and Miani C. (2025). A questionnaire for a conceptual framework and interdisciplinary public health research using the Delphi technique—development and validation. Front. Public Health. 13:1436569. doi: 10.3389/fpubh.2025.1436569