Assignments report
Assignments report helps you keep track of your tasks by comparing the assignments you’ve scheduled with the time you’ve actually spent on them with a breakdown of cost and billable amounts for scheduled and tracked time. This article will show you how to use assignment reports effectively so that you can easily manage your workload and monitor financial data over selected period.
This is a paid feature available to all users when upgrading a workspace to a Pro or Enterprise plan.
Assignments report might come in handy in the following case:
Let’s say as a project manager, you are overseeing a software development project with multiple assigned tasks and team members. You check the Assignments report for the past month to compare scheduled assignments with the actual tracked time by your development team. The report reveals that certain tasks took longer than initially estimated. With this insight, you can identify areas for improvement, like refining task estimates, adjusting project timelines, or redistributing workload.
See assignments #
To see the Assignments report, Scheduling needs to be enabled in the Workspace settings.
To do that:
- Navigate to the workspace name at the top of the page
- Open the menu and choose the Workspace settings
- Find the Scheduling section in the General tab
- Toggle the switch to Activate project and team scheduling
- Optionally, enable the Regular users can see everyone’s assignments
- Toggle the switch to See billable and cost account

Now that you’ve enabled Scheduling, you can check out the Assignments report:
- Go to the Reports in the sidebar
- Choose the Assignments from the dropdown
Assignments report displays:
- Total scheduled time for published assignments
- Cost and billable amounts for scheduled and tracked time
- Total tracked time
- Difference between scheduled and tracked time
- Expected and realized profit
- Performance column with progress bar
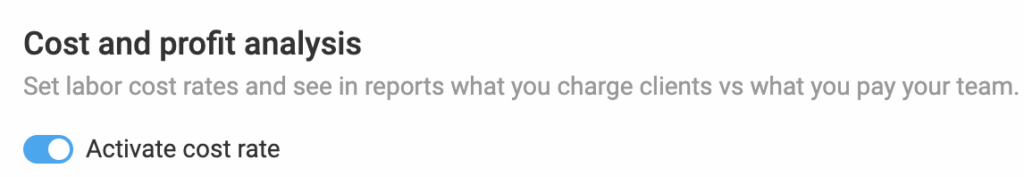
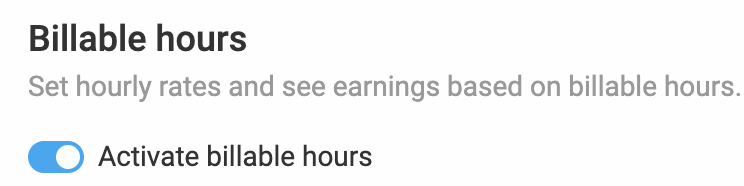
If you don’t have billable hours or cost rates activated on your workspace settings, the “Expected Profit” and “Realized Profit” columns will not be visible.
The Assignment report shows the following information:
| Item | Description |
| Scheduled | The total number of hours planned for published assignments |
| Amount scheduled | The total expected billable amount based on the planned hours |
| Cost scheduled | The total expected cost based on the planned hours |
| Expected profit | Scheduled Revenue minus Scheduled Cost |
| Tracked | The total number of hours actually recorded |
| Amount tracked | The total billable amount based on the hours actually recorded |
| Cost tracked | The total cost based on the hours actually recorded |
| Difference | The difference between Scheduled Hours and Tracked Hours |
| Amount difference | The difference between Scheduled Revenue and Tracked Revenue |
| Cost difference | The difference between Scheduled Cost and Tracked Cost |
| Realized profit | Tracked Revenue minus Tracked Cost |
| Status | The percentage of the assignment completed, based on scheduled hours |
The results on the page can be grouped on three levels based on the entities you choose.
Group entries #
When you’re analyzing the Assignments report, you have the option to group entries in three levels. As a result, the report will organize the data based on the intersection of these criteria and the total hours tracked by users within those groups.
- First level of grouping: Project, User, Group, Client, Month, Week, or Date
- Second level of grouping: Project, Task, Client, Group, Month, Week, or Date
- Third level of grouping: Task, Group, Month, Week, or Date
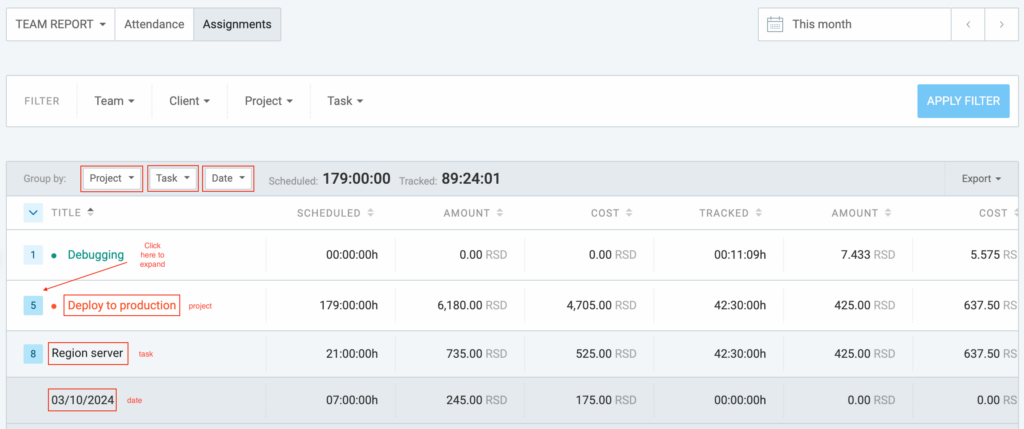
For example, you might choose to first group your Assignments report by Project, then within each project, group by Task, and finally, within each task, further divide by Date.
Project > Task > Date
In the Assignments report, this grouping look like this:
You can also filter the results by date in the date picker, team (users and groups), client or project and export them in CSV/Excel format.
If you, for instance, group by User or Group, you’ll get available and scheduled hours and, in that way, can determine user’s availability for the selected date range.
Export Assignments report #
If you’d like to obtain the Assignments report and distribute it in CSV or Excel format to subject matter experts, relevant parties, or internally in your company, you can do that from the Assignments report page.
- At the top right corner of the page, click the Export button to expand dropdown
- Choose preferred format CSV/Excel
The report will be downloaded and saved on your computer.
The grouping options affect the way your exports look. For example, if you group by project, further group by task and finally group by date, that’s the way data will be grouped in the export, as well.
More on reports #
If you want to view reports on your time and expenses categorized by project, client, user, group, tag, or specific date, explore our Summary report.
To see a weekly breakdown of your tracked time and expenses, visit our Weekly report article.
To export and edit all the details of your entries, refer to the Detailed report article.