It’s that time of year — time for performance reviews. And again, you feel like you’re blindly giving feedback without any objective data to back up your claims.
To help you avoid biased and inaccurate performance evaluations, we’ve created a free performance rating calculator.
Read on to learn about different performance appraisal methods and how to use the free calculator below.

What is an employee performance rating calculator?
An employee performance rating calculator is a tool that generates an objective score for employee performance based on predefined criteria. In short, this calculator can include diverse sections of evaluations, including:
- Competencies — skills that employees should have when working in a particular position (e.g., knowledge of specific software or language).
- Performance goals — to determine whether an employee is making progress toward predetermined objectives.
Each of the above evaluation sections has the following components:
- Content item — a quality, skill, or qualification of an employee being evaluated.
- Sections — each section includes several content items that belong to the same group. For example, the Competency section could include content items like Punctuality, Productivity, and Communication.
- Rating models — the employee performance rating scale you use to evaluate the content items of an employee. The range is 1 to 5, with 5 being the maximum numeric rating.
- Weight — a way to indicate the importance of content items.
- Section rating — the rating you get for a particular section, once everything is calculated. If a section rating is a decimal number, you need to round it. Then, you’ll get a numeric rating. Plus, on a micro-level, every item has its own numeric rating called item numeric rating.
- Decimal score — the score you get when you divide the item numeric rating by the maximum numeric rating.
- Weighted score — the score you get when you multiply the decimal score by the weight.
As a department head or operations manager, you need to examine each content item and each section to analyze employee performance and work quality.
Here’s a free performance rating calculator you can use:
Benefits of using an employee performance rating calculator
An employee performance evaluation calculator is convenient for evaluating workers and obtaining measurable feedback on their work performance. Here are the main reasons why you should try this calculator:
- It’s easy to use and all calculations are automatic.
- Since the evaluation of all your employees will follow the same pattern, you’ll promote transparency and equality among employees.
- It gives you a clear, tangible overview of employee performance, which promotes team accountability and motivates workers to improve.
- The results from the calculator will show which areas of work employees need to improve. It will also help you identify top performers.
💡 CLOCKIFY PRO TIP
If you find that the feedback you give your employee isn’t effective, read this helpful article on constructive feedback:
What’s the difference between performance appraisal methods with and without weighting?
For proper evaluation, you should first decide whether to rate employee performance with or without weighting.
The average method with weighting works well when you want to underline the importance of specific elements of employee performance. So, to separate content items of varying importance, you add different weights to each item.
Weights are usually added when there are non-quantified activities in the sections, like effort or teamwork. The sum of all weights of content items in the same section has to be 100. Aside from items, sections themselves can also have weights. The sum of all section weights must also be 100.
In contrast, the average method without weighting is ideal if you need simple metrics to review employee or team performance, without too many in-depth analyses. This method excludes the weight, so all content items hold equal value.
To explain how to evaluate employee performance with our calculator, we’ll now explore 3 different sections:
- Competencies,
- Performance goals, and
- Overall summary rating.

How to calculate employee ratings without weighting?
Poorly executed performance reviews lead nowhere. Without clear metrics, you won’t be able to identify top performers and team members who need improvement. In fact, according to Deloitte, as many as 75% of organizations believe their employee evaluation methods are ineffective.
So, if you’re looking for simple metrics and a straightforward appraisal method, consider the option without weighting.
It helps you quickly identify top performers and employees who need more training.
Here’s how to use the method without weighting.
The average method without weighting: Competencies
When evaluating employee competencies, pick the qualities you find significant in this category. These qualities will be your content items.
For example, if you’d like to analyze the productivity levels of your employees, you should include productivity as one of the competencies. After evaluation, if you notice that these levels are below expectations, you can help employees increase their productivity.

As you can see from the image above, we compiled a list of 6 competencies. The maximum numeric rating for all is 5. Next to the competencies is the item numeric rating that shows how successful an employee is in each area.
In this example, we can see that a worker has high marks for productivity and punctuality, but a very low mark for attendance.
To get decimal scores for these fields, the calculator automatically divides the item numeric rating by the maximum numeric rating:
4 / 5 = 0.8
5 / 5 = 1.0, and so on.
Next, the calculator sums up the total decimal score for all competencies:
0.8 + 1.0 + 0.6 + 0.8 + 1.0 + 0.4 = 4.6
Since you need a rating for the entire section, the calculator divides the total decimal score by the total maximum decimal score. The total maximum decimal score is equal to the number of skills/competencies that you added to the calculator. In this case, it’s 6.
4.6 / 6 = 0.76
After division, the number gets multiplied by the maximum numeric rating.
0.76 x 5 = 3.8
Finally, the result is the section rating.
Now, if the section rating is a decimal number, you have to round it to get a numeric rating. Here, it’s 3.8, so it would be 4. The section rating for this example is 4. If you use our performance rating calculator, rounding is done automatically.
💡 CLOCKIFY PRO TIP
If you’re wondering how to measure employee productivity fairly, here’s a helpful article:
The average method without weighting: Performance goals
When you want to examine if employees reached performance goals, you need to select the most significant objectives. As the department lead, ensure these goals align with your department’s goals.
For instance, when analyzing the performance of a sales representative, the crucial goals could be:
- Improving customer service,
- Increasing profit, and
- Setting monthly sales goals.
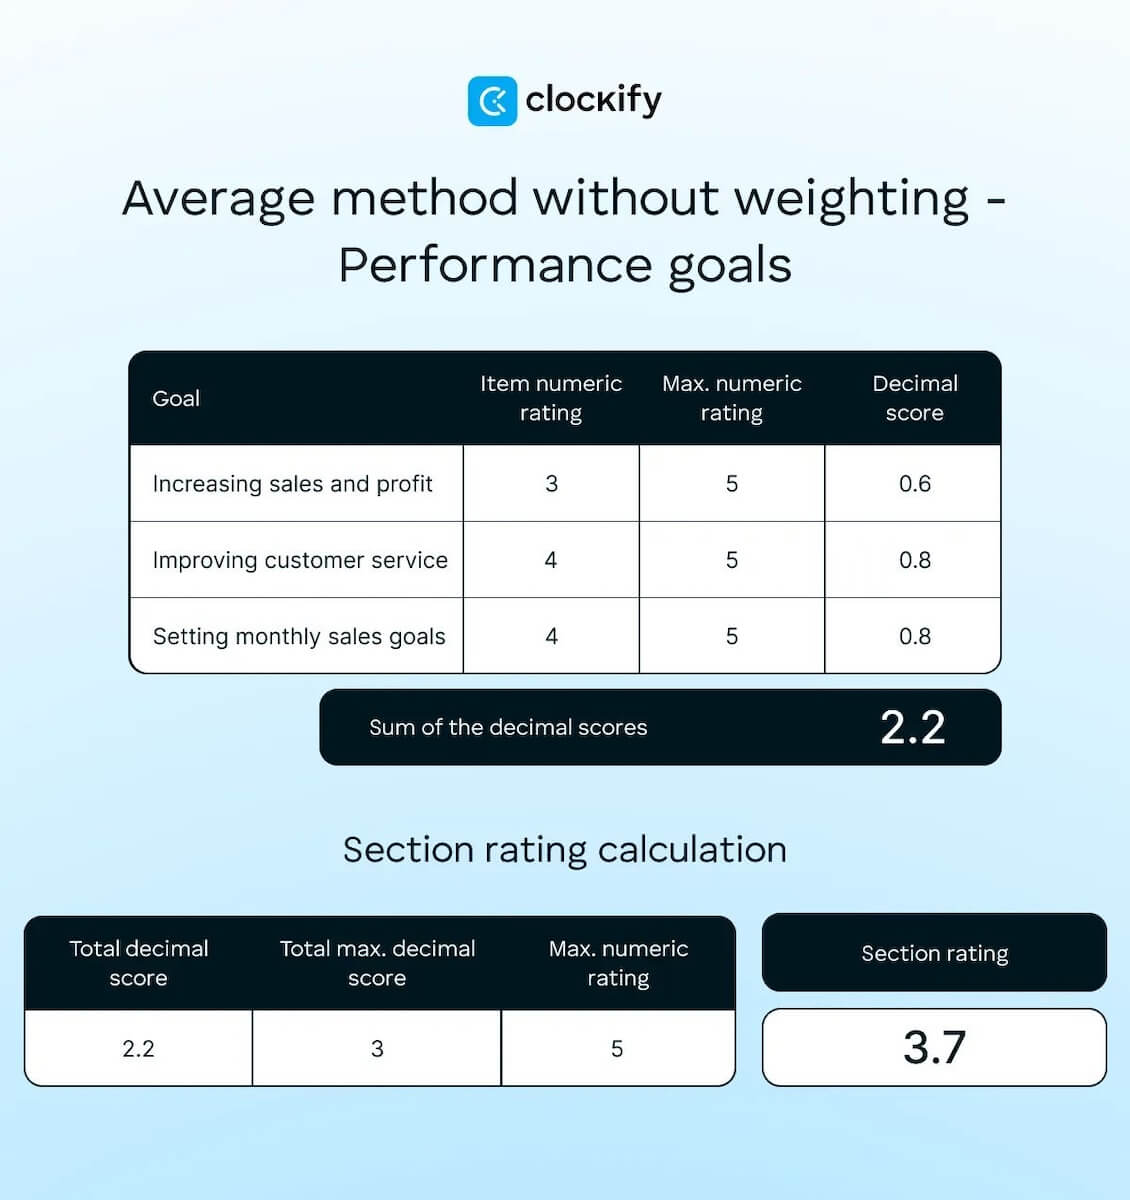
The process of calculating the decimal score is the same as in the earlier example:
3 / 5 = 0.6
Once you input all item numeric ratings, the calculator will show you all decimal scores and their total:
0.6 + 0.8 + 0.8 = 2.2
Also, the process of calculating the section rating for goals works the same as for competencies. Since there are 3 goals here, the total maximum decimal score is 3.
2.2 / 3 = 0.73
0.73 x 5 = 3.65
In this case, the section rating is 3.65, so it will be rounded to 4.
The overall summary rating without weighting
For the overall summary rating, the calculations are simple. The calculator determines the average numeric rating for the sections we covered earlier.
The process of calculating an average numeric rating is to get the total of all section ratings. Then, this total is divided by the number of sections. For example, if there are 3 sections, the calculator divides the total number of numeric ratings by 3.
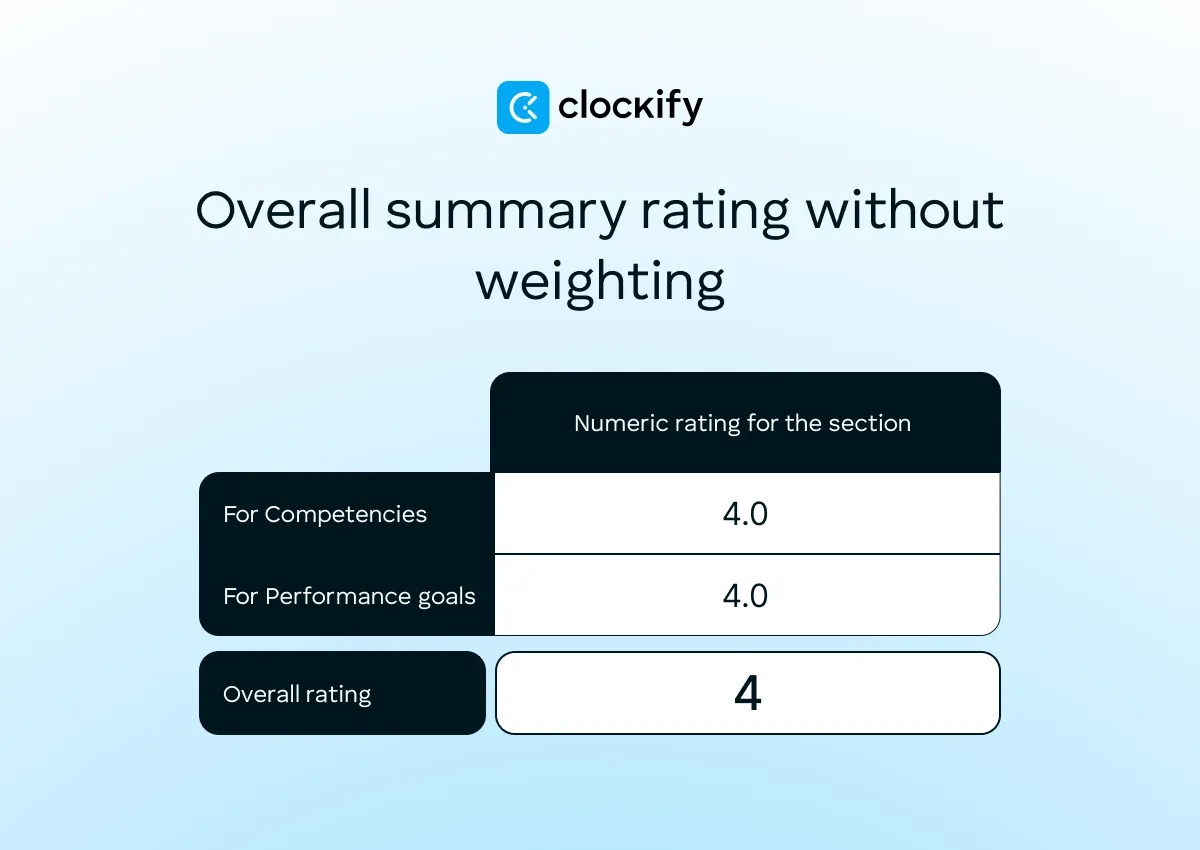
In our case, the numeric ratings for both sections are 4, and there are 2 sections. So, the overall rating is:
(4.0 + 4.0) / 2 = 4
The overall summary rating is 4.
How to calculate employee ratings with weighting?
Sometimes, the employee evaluation method without weighing isn’t precise enough. You may still struggle to identify the most efficient team members, especially for profitability.
That’s where calculating employee ratings with weighting comes in handy. Adding weight to different performance elements allows you to evaluate them by importance — the higher the weight, the more important the content item.
If you, as an operations manager, want to get feedback on all managers or the whole team, the elements with higher weight would be leadership and teamwork.
On the other hand, if you decide to analyze sales agents, the elements with higher weight would be customer service and communication.
The average method with weighting: Competencies
When using a method with weighting, the first step is to pick the most important competencies an employee should have. The following step is the same as for a method without weighting — adding the maximum numeric rating.
Then, you have to think about how an employee is performing compared to the maximum rating. You’ll add these ratings to the item numeric rating column.
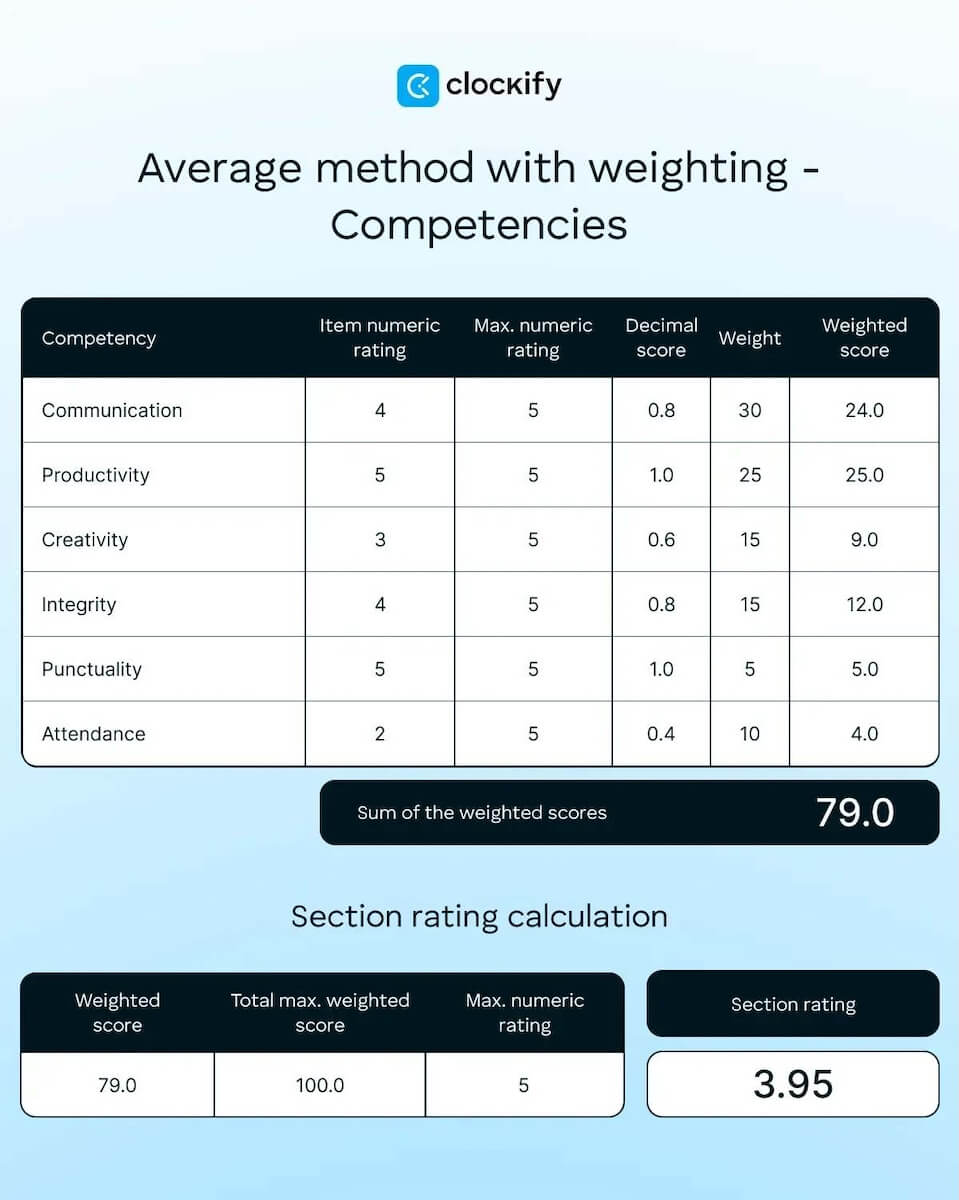
The digital calculator will automatically measure the decimal score by dividing the item numeric rating by the maximum numeric rating. These decimal scores are identical to the ones from the previous method (calculating competencies without weighting).
As you can see in the image above, competencies have their own weights based on their importance. The sum of all these weights is 100.
In our case, the most significant competency here is communication, with a weight of 30. Yet, the least important ones are attendance and punctuality. Speaking of attendance, if your team is showing low marks in this field, try establishing a rule of employee time tracking.
Next to the weight, there’s a weighted score column. To get the weighted score, the calculator multiplies the decimal score by the weight:
0.8 x 30 = 24.0
1.0 x 25 = 25.0, and so on.
Then, the total weighted score is automatically presented below:
24.0 + 25.0 + 9.0 + 12.0 + 5.0 + 4.0 = 79.0
Here’s the process of estimating the section rating — the calculator divides the weighted score by the total maximum weighted score, which is always 100.0:
79.0 / 100 = 0.79
Now, the decimal number should be multiplied by the maximum numeric rating:
0.79 x 5 = 3.95
The section rating is 3.95, so it will be rounded to 4.
The average method with weighting: Performance goals
You can emphasize specific performance goals when creating employee appraisals. This means that the Performance goals section will be weighted as well. So, every content item (goal) needs to have its own weight, too.
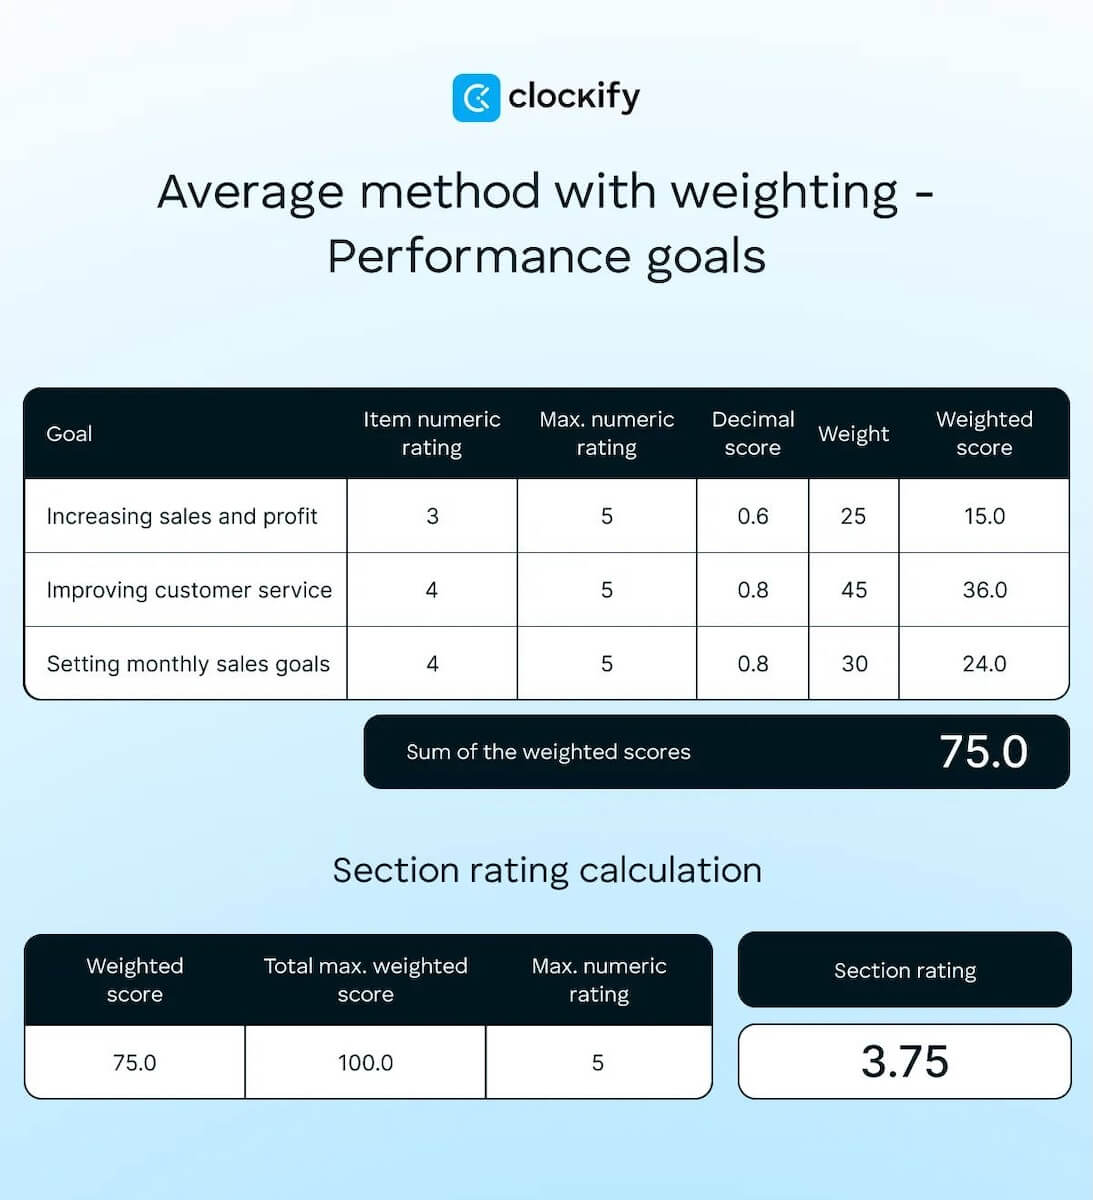
Just like we did in the method without weighting, the first step is to evaluate your employee in every field — for every work goal. Once you do that, you’ll have an item numeric rating column ready. Be sure to add the maximum numeric rating, too.
The calculator will divide these ratings by the maximum numeric rating to get decimal scores:
3 / 5 = 0.6, and so on.
Now that you have decimal scores, you’ll need to determine the weight for every goal in the section. The sum of these weights has to be 100.
Then, the calculator will automatically show you the weighted score by multiplying the decimal score by its weight:
0.6 x 25 = 15.0, and so on.
Besides, you’ll have a sum of the weighted scores:
15.0 + 36.0 + 24.0 = 75.0
To calculate the section rating, the calculator divides the weighted score by the total maximum weighted score:
75.0 / 100 = 0.75
Furthermore, this decimal number gets multiplied by the maximum numeric rating:
0.75 x 5 = 3.75
The section rating is 3.75, so it will be rounded to 4.
💡 CLOCKIFY PRO TIP
To learn how to set realistic, measurable goals, check out the following article:
The overall summary rating with weighting
To determine the overall summary rating with weighting, the calculator would need to have decimal scores for all sections. So, you need to input numeric ratings for the weighted sections and the maximum numeric rating.
The calculator will then present the decimal score for both sections. In our case, numeric ratings are the same, as well as the maximum numeric rating, so the calculation is:
4 / 5 = 0.8

We already mentioned that, aside from content items, sections have weights, too. In this case, the Competency has a higher weight (55) than Performance goals (45). So, you need to add their weights to the calculator. That way, the calculator will multiply the weight by the decimal score for the section:
55 x 0.8 = 44.0
45 x 0.8 = 36.0
The sum of the weighted scores is:
44.0 + 36.0 = 80.0
Finally, the calculator uses this sum, divides it by the total score (always 100), and then multiplies it by the maximum numeric rating:
80.0 / 100.0 = 0.8
0.8 x 5 = 4
The overall rating is 4.
This method allows you to fairly rate each team member’s performance when you have categories of varying importance. And for an even more effective employee rating, you can use powerful performance evaluation tools, like Clockify by CAKE.com.
Get tangible data with Clockify
FAQs about performance appraisal methods
If you need more information on how you can rate employee performance, here are some of the most frequently asked questions.
What are the 5 levels of performance rating?
The 5 levels of performance rating describe employee performance on a scale of 1 to 5. Multiple variations of the 5-point scale exist, but here’s one example:
- 1 — Doesn’t meet expectations,
- 2 — Partially meets expectations,
- 3 — Fully meets expectations,
- 4 — Frequently exceeds expectations, and
- 5 — Consistently exceeds expectations.
What are 5 scale rating examples?
Let’s say you’re using the 5-point scale to rate an employee’s productivity. If this worker mostly completes their tasks on time but doesn’t take initiative or put in extra effort, you could rate their productivity as a solid 3. This means they meet the expectations but don’t exceed them.
What is the 4-point rating scale for performance?
The 4-point rating scale for employee performance is similar to the 5-point one, except that the ratings go from 1 to 4. Here’s one variation of the 4-point rating scale:
- 1 — Unsuccessful performance,
- 2 — Fully successful performance,
- 3 — Superior performance, and
- 4 — Exceptional performance.
How do you calculate the performance appraisal percentage?
To calculate the employee rating percentage, divide the overall score by the maximum numeric rating, then multiply by 100. For example, if your employee scored 4 out of 5, the calculation would look like this:
4 / 5 x 100% = 80%
💡 CLOCKIFY PRO TIP
Are your employees absent too frequently? If you’re unsure whether their absences are out of the ordinary and unjustified, use our free Bradford Factor calculator to identify disruptive absences:
Use Clockify reports to evaluate employee performance
Do you still manually extract data from timesheets and project tools for performance reviews? If you do, you’ve probably already recalled how much time, mistakes, and frustration went into it all.
But it doesn’t have to be so time-consuming and complicated.
Instead, rely on Clockify by CAKE.com to track project progress and generate reports whenever you need them.
For example, in Clockify’s assignments report, you can see details like names of team members, clients, and projects — and filter the data any way you like.
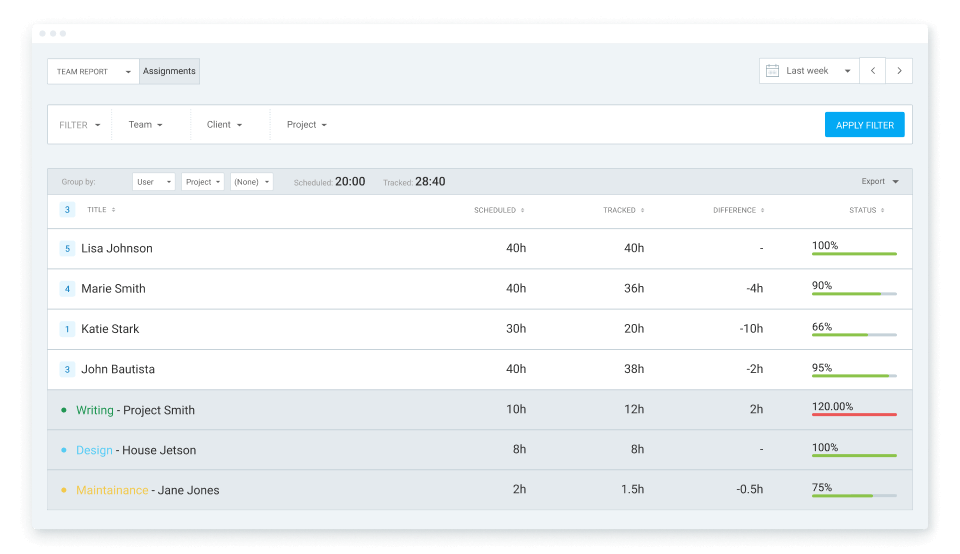
This report also shows the difference between scheduled and tracked time for each team member. For illustration, you’ll see 2 columns, Scheduled and Tracked, indicating the number of hours for each category.
Suppose you have 40 hours set in the Scheduled section but more than 40 hours in the Tracked section. This would mean that the employee in question is taking longer than expected to complete their tasks. If that’s the case, you’ll see a red line on the right-hand side of your screen.
After you’ve accumulated enough data regarding team performance, you can use Clockify for future performance predictions and project estimates.
For example, the app’s forecasting feature shows when the team is expected to finish a project. It also notifies you if the project is about to go over your time estimation.

Finally, you can use this information to:
- Improve your workflow,
- Ask coworkers if they need your help, or
- Take another appropriate action.
Harness the power of reporting features to gain deep insights into your team’s performance.