Understand & use your reports
This guide will walk regular users through how to view, interpret, and filter their time-tracking reports in Clockify. You will learn how to access various report types, filter by specific criteria such as date, project, or client, and customize reports to fit your needs.
Overview of reports #
Clockify offers several types of reports to help you track time and expenses:
Summary report #
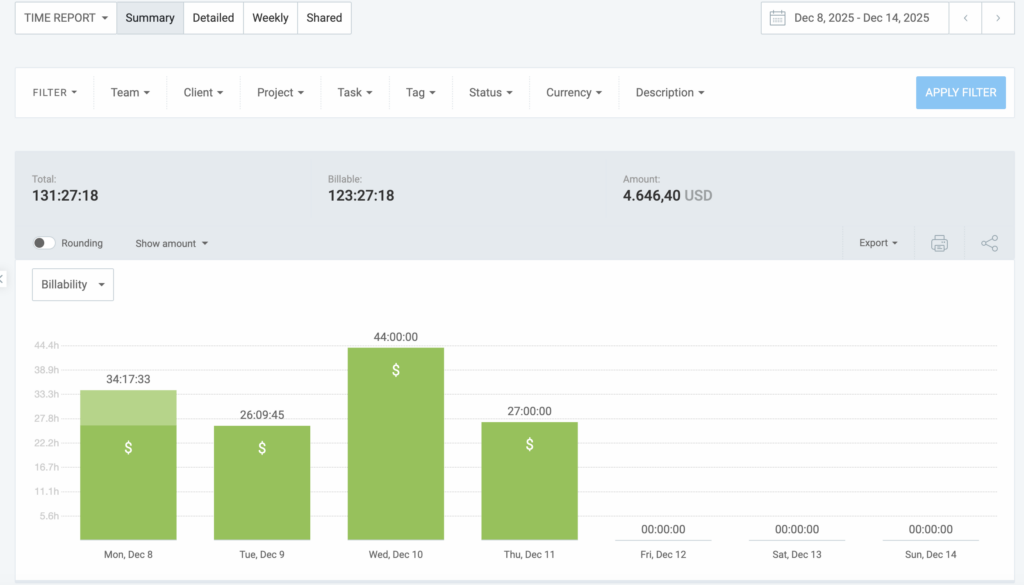
The Summary report groups your time entries by project, client, user, tag, and date. It’s ideal for getting an overview of your time entries over a specific date range.
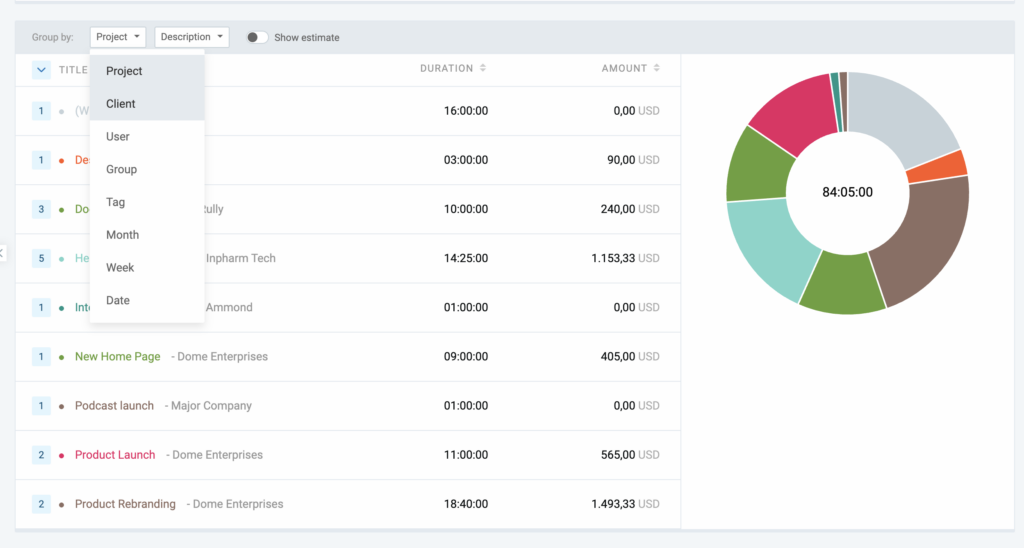
Group by feature
The Summary report data can be grouped by Project, Client, User, Tag, or Date to change how the information is visualized.
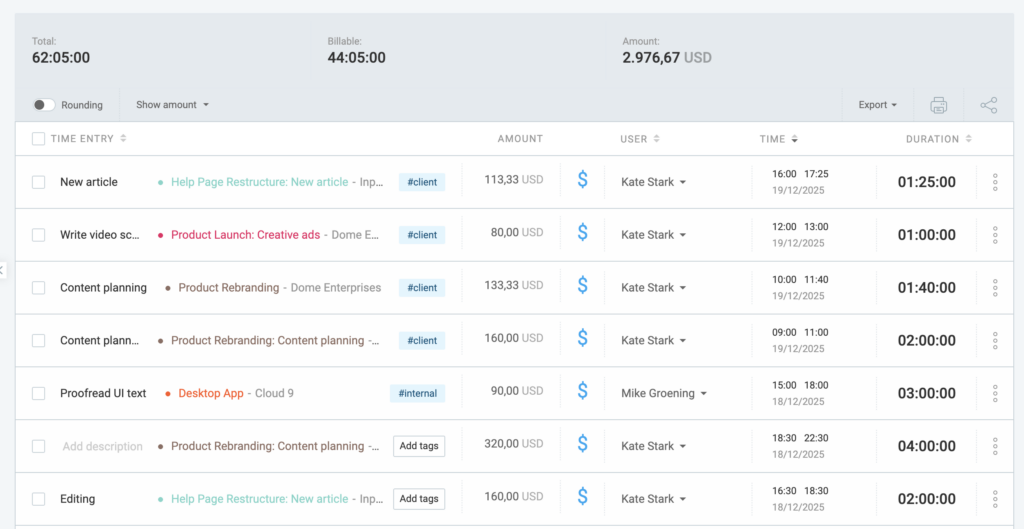
Detailed report #
This report shows all the details of your time entries, without grouping or summarizing. It provides a line-by-line breakdown of each time entry.

Weekly report #
Weekly report is great for weekly tracking because it shows time entries grouped by user or project within a fixed week range.
Navigate the reports #
To access and navigate the reports section:
- Go to the Reports page in the sidebar
- Choose between the Summary, Detailed, or Weekly report, depending on your needs
If the Reports page is not visible, check with your Workspace Admin, as they might have restricted it.
Time rounding #
Time rounding is a paid feature available in the Standard, Pro, and Enterprise plan.
The Time rounding switch toggles between displaying the exact time tracked and the rounded time as defined in your Workspace settings.
When the switch is turned ON, the report applies your specific rounding rules. When the switch is turned OFF, the report reverts to showing the exact duration of each time entry as originally recorded.
To enable Rounding in reports:
- Go to Reports
- Select a report (Summary/Detailed/Weekly)
- Enable the Rounding switch on top of the report’s table
Check out Time rounding to learn more about this feature.
Filter your reports #
Clockify allows you to filter your reports by several criteria to get the data you need. For more precise reporting, you can enable or disable rounding for the time entries.
Date range #
The date range filter defines the time period for the data displayed in the report.
Click the date picker in the top-right corner to select a custom range, or use presets such as This week, Last month, or This year.
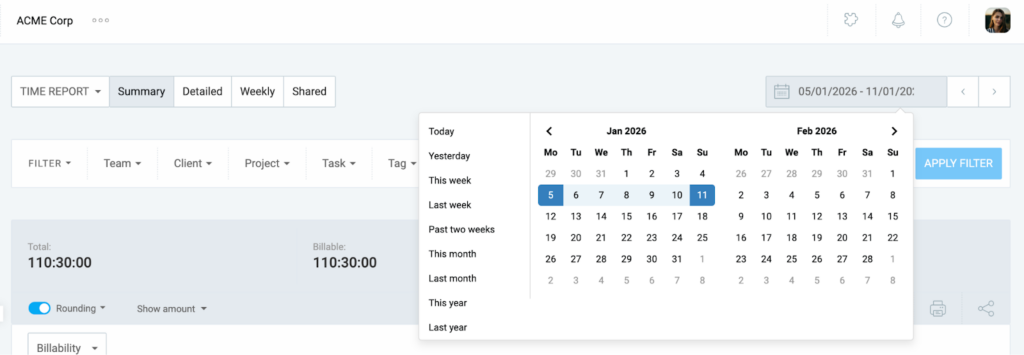
You can select a date range up to 31 days (1 month) if you’re on the Free plan.
Project #
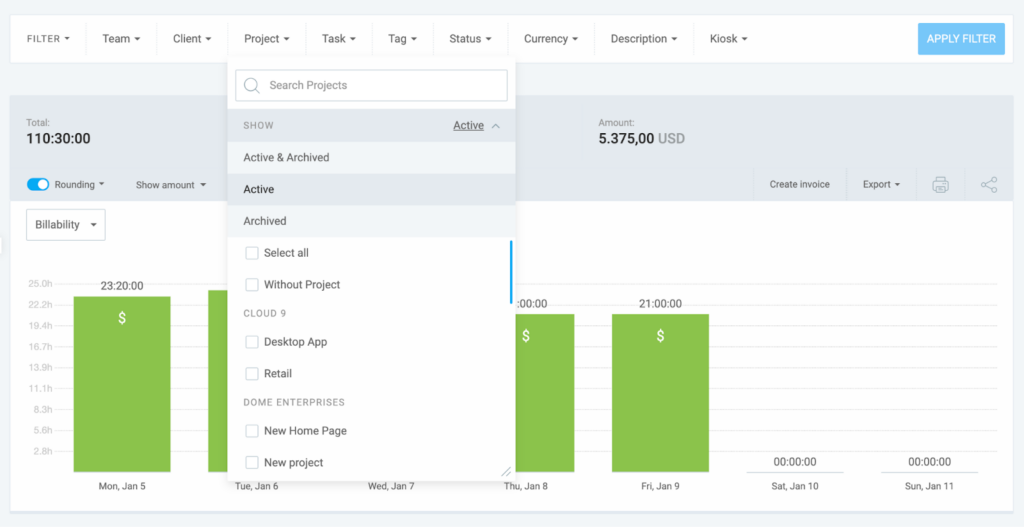
To view entries linked to particular projects, use the Project filter.
Select one or more projects from the dropdown. You can also filter by Active, Archived, or Without Project.
Client #
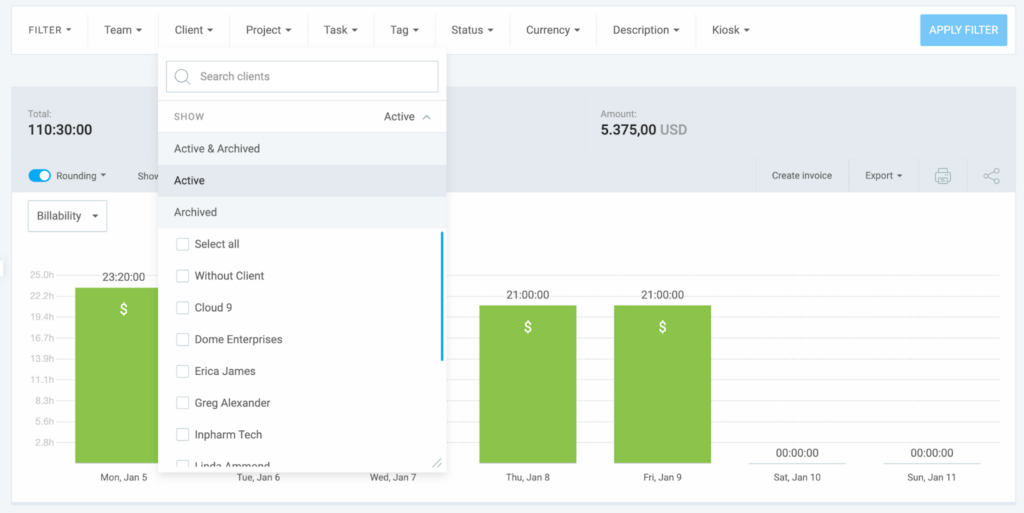
This filter shows time tracked for specific clients across all their projects.
Select a client to automatically include all their projects. Includes options for Active, Archived, and Without Client.
Team/User #
Filters the report to show entries from specific team members or groups. Includes filters for All, Active, Inactive, Groups, Without group, and Users (individual team members).
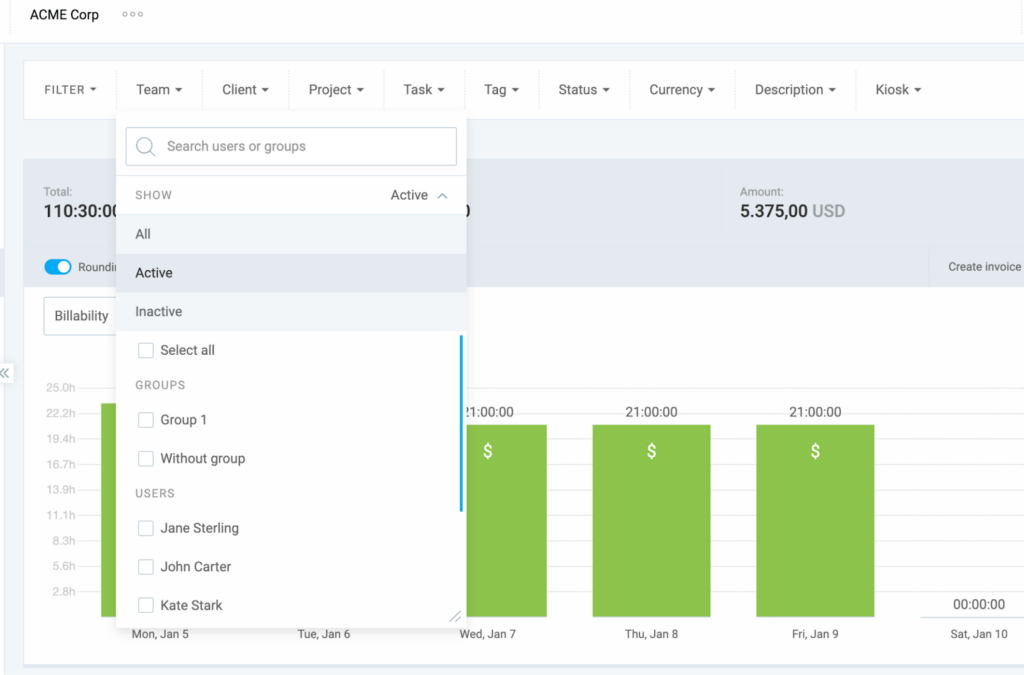
Admins can select individual users or entire user groups. Regular users typically only see their own time, depending on the Workspace permissions.
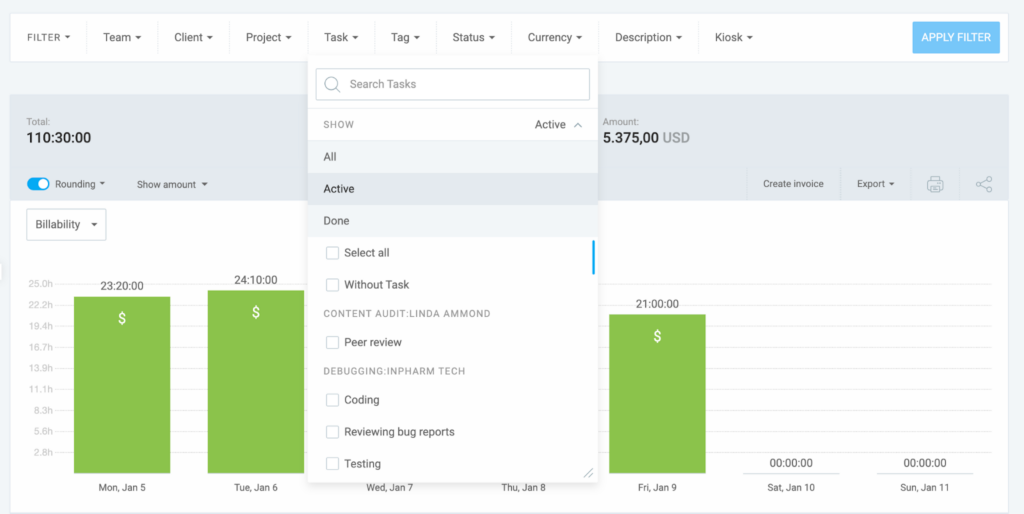
Task #
Use the Task filter to show specific tasks within projects. Includes filters for All, Active, Done, and Without task.
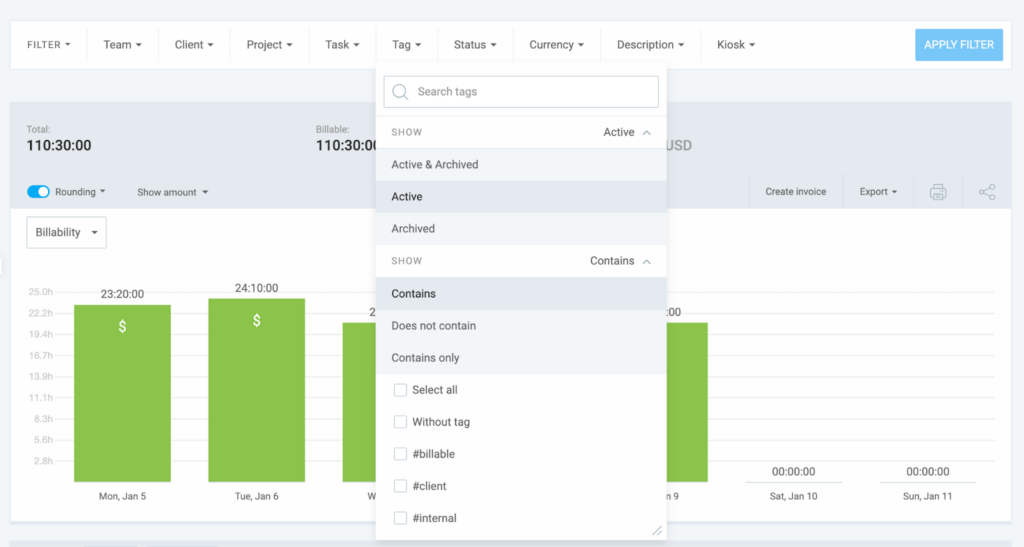
Tag #
The tag filter categorizes and filters entries using custom labels.
Use three modes:
- Contains (any selected tag)
- Does not contain (exclude tags)
- Contains only (must have all selected tags)
Status #
Filters entries based on their billability or approval state.
Choose between Billable, Non-billable, or (if enabled) status options such as Approved, Pending, or Invoiced.
Description #
A text-based search for specific words within time entry notes.
Type a keyword into the description filter to find all entries containing that specific text.
Custom fields #
Custom fields is a paid feature available on the Pro or Enterprise plan.
Filters by user-defined data fields. Enable specific custom fields in the filter dropdown to see entries that match specific custom data values.
Analyze report data #
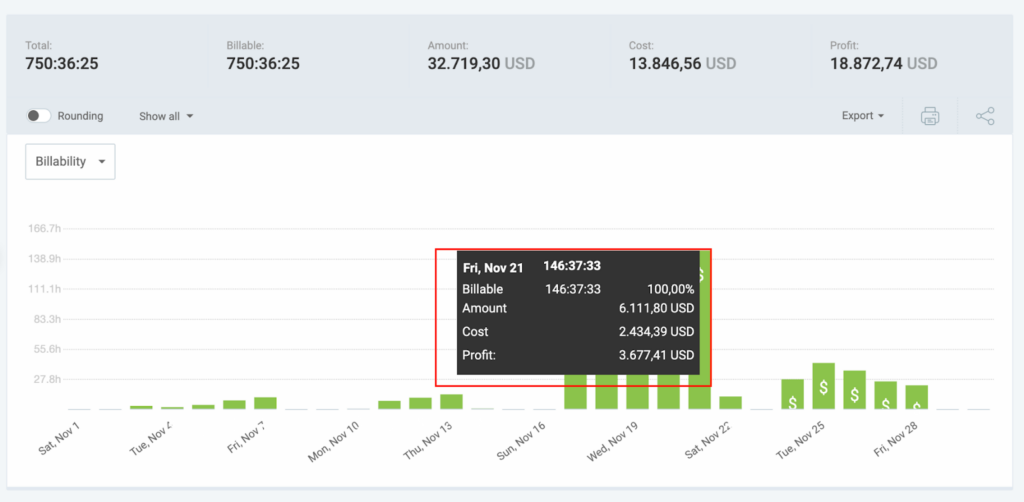
When you generate a report, Clockify calculates several core metrics based on your filters. Here is what each one represents:
- Total time: Total of all hours tracked during your selected period, which includes every entry, regardless of whether it is billable or not
- Billable vs. non-billable:
- Billable: Hours marked with the $ icon, intended for client invoicing
- Non-Billable: Internal work or tasks that aren’t charged to a client
- Total amount: The total earned revenue is calculated by multiplying your billable hours by your hourly rates.
- Average rate: (Visible in specific views) The weighted average of the different hourly rates applied across the report
- Project breakdowns: If you group by Project, you’ll see a visual progress bar or list showing how much of your total time was dedicated to each specific project
- User productivity: Summary of how many hours each team member contributed within the selected timeframe
Export report #
You can only export or save reports as PDF if you’re on the Free plan. Upgrade to any paid plan to export or save reports as CSV or Excel files.
To export a report:
1. Go to Reports
2. Select Summary, Detailed, or Weekly
3. Apply filters if applicable to generate the report you want
4. Click on the Export button
5. Select your preferred export option:
- Save as PDF: Generates a document that’s ready for printing or emailing directly to clients for invoicing and record-keeping
- Save as CSV: Creates a raw data file compatible with almost any database or software, ideal for those who need to import time entries into other tools
- Save as Excel: Exports your data into a structured spreadsheet, allowing you to perform complex calculations, create pivot tables, and build custom charts
- Customize: Opens a menu to toggle specific data columns (like notes, start/end times, or tags) on or off, ensuring your export includes only the information you need
Share or save a report #
Share reports is a paid feature available on any paid plan.
You can create a link to a report and share it with others or save it for your own reference.
To do this:
- Go to the Summary, Detailed, or Weekly report and set your desired date range, projects, users, or tags.
- Locate the Share icon at the top right of the reports page
- Enter the name of your report in the pop-up window
- Choose whether the report should be Public or Private
- Click Create Link
Public means anyone with the link can see it (even people without a Clockify account), while Private means only logged-in workspace members can see it.
Once saved, the report will appear in the Shared tab of the Reports page, where you can copy the link.
If you choose a relative date (e.g., This Month), the saved link will always show the current month’s data when clicked in the future.