While making decisions, business leaders are often swamped with vague and subjective information from too many sources.
To cut through the noise and make the right calls, you need clear, objective data.
That’s where Key Performance Indicators (KPIs) help you tangibly measure progress towards business goals.
In this text, we’ll explain KPIs in more detail, show you how to set them, and provide some practical examples.
KPI definition — what are Key Performance Indicators?
Key Performance Indicators (KPIs) are quantifiable measures that show your performance against a specific goal or target. KPIs can track the performance of an individual, a team, or an entire company.
For example, a streaming service like Netflix might set a goal to get 500,000 new subscribers by the end of the quarter. In this case, the number of new subscribers is the KPI.
By tracking this metric, the company can see if it’s more or less likely to hit its quarterly target. Together with other KPIs, Netflix can also use such data to answer fundamental business questions, such as:
- Are we meeting customer expectations?
- Are we meeting employee expectations?
- Are we using more resources than expected to achieve these goals?
So, which KPIs should you track? That depends on various factors, including the specifics of your business and industry.
Let’s explore some of the different types of KPIs.
What are the different types of KPIs?
Economists and managers group KPIs according to various criteria. The 2 most common ones are:
- Organizational scope, and
- Contribution to organizational goals.
We’ll explain both below.
Type #1: KPIs based on organizational scope
While a (well-run) company has a unified business vision, individual departments and employees have different goals and measures of success. This also means that Netflix’s CEO and software engineering department track different KPIs.
Based on organizational scope, we divide KPIs into:
- High-level KPIs — tracking the overall performance of the organization, and
- Low-level KPIs — tracking the performance of individual employees, teams, and departments.
You can also classify KPIs by the value they bring to your company.
Type #2: KPIs based on contribution to the organization
Based on how they help the organization, we can divide KPIs into 5 types:
- Input KPIs measure the amount, type, and quality of resources needed to produce outputs, such as the cost of employees.
- Output KPIs measure what is produced from the inputs, like profit growth or the number of goods sold.
- Process KPIs measure the quality and efficiency of equipment and processes. For example, the time needed to produce a product or deliver a service.
- Project KPIs track the status of deliverables and progress toward project milestones. These help project managers assess successes, failures, and further steps.
- Outcome KPIs measure final achievements, such as increases or decreases in market share.
This distinction is useful in management frameworks like balanced scorecards, which require a combination of financial and non-financial KPIs.
Track projects & tasks with Clockify
How do you set KPIs?
Now that you understand KPIs and their different types, let’s examine how to set KPIs and apply them in practice.
Step #1: Define business objectives for your KPIs
Before creating any KPIs, start by clearly defining the business objectives they will measure. For instance, having a higher market share is a business objective you want to achieve, and current market share is the KPI you’d measure to check your progress.
Each company operates in a specific market environment, so you can’t just copy KPIs from others. Adidas and Nike are both huge sports apparel brands and direct competitors, but they often measure different KPIs.
Your KPIs should be specific to your organization and directly tied to your success. Otherwise, you’re probably wasting time and resources without achieving anything meaningful.
For example, you may want to improve your employees’ productivity. In this case, your business objective is to reduce the time spent on each task without compromising quality.
💡 CLOCKIFY PRO TIP
Need help setting daily goals and hitting them consistently? Check out this guide on setting and reaching daily targets:
Step #2: Link your objectives with your KPIs
Now that you’ve set clear and relevant objectives for your company, it’s time to link them to your KPIs.
Each KPI should be connected to a specific goal and help you reach it. Also, individual employees shouldn’t track too many KPIs, or their productivity will be far from optimal.
Here’s what Jensen Savage, the founder and CEO of a digital marketing agency, thinks about setting the right number of KPIs:

“In my experience, 3 to 5 KPIs per team or employee is the sweet spot. It’s enough to offer meaningful insight without creating KPI overwhelm. When teams track too many metrics, I’ve found that focus becomes fractured, which impacts performance as a whole.”
In our productivity example, we’ll keep things simple — each employee could track the time spent on daily tasks, and managers can track the total time for their teams.
Ironically, noting the time you spend on each task may seem time-consuming, but only if you do it manually. You and your team can use a free tool like Clockify by CAKE.com to simplify time tracking.

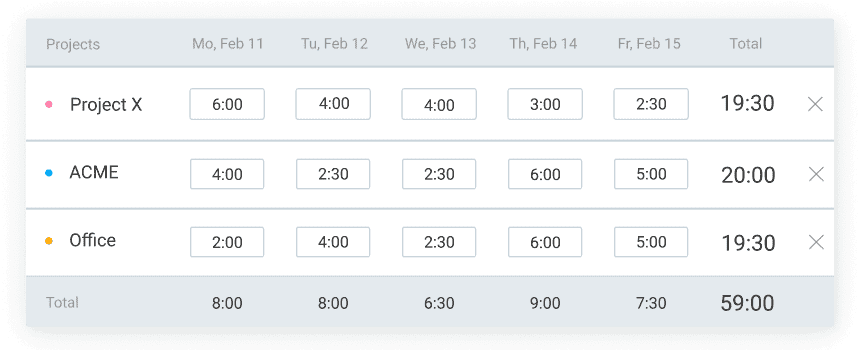
In Clockify, you and your staff just start a timer when you begin working on a task, and stop it once you’re done.
Based on data from the timer, Clockify automatically fills in timesheets for each employee.
With Clockify, you can track your team’s productivity without increasing anyone’s workload. That way, you get a happy workforce that’s laser-focused on reaching company objectives.
Track productivity with Clockify
💡 CLOCKIFY PRO TIP
Need help figuring out your priorities and managing your time better? Check out this blog on a practical method for improving your time management:
Step #3: Define success
To see if you’re achieving your goals, you first need to define what success looks like. This means identifying the key measurable results tied to your business objective.
In our productivity example, success might look like:
- Increasing the number of completed tasks per week, or
- Reducing the time spent on each task.
Once you’ve defined your success criteria, the next step is to decide how you’ll measure them.
Step #4: Decide how you will measure success
Once you’ve set your success criteria, it’s time to decide how you’ll measure them in practice. Research suggests visual breakdowns of KPIs help companies make timely and informed decisions.
In our previous example, the appropriate performance metrics would be:
- Number of tasks completed per week, and
- Time spent on each task.
Clockify by CAKE.com automatically generates visual reports showing both metrics for each employee and team.
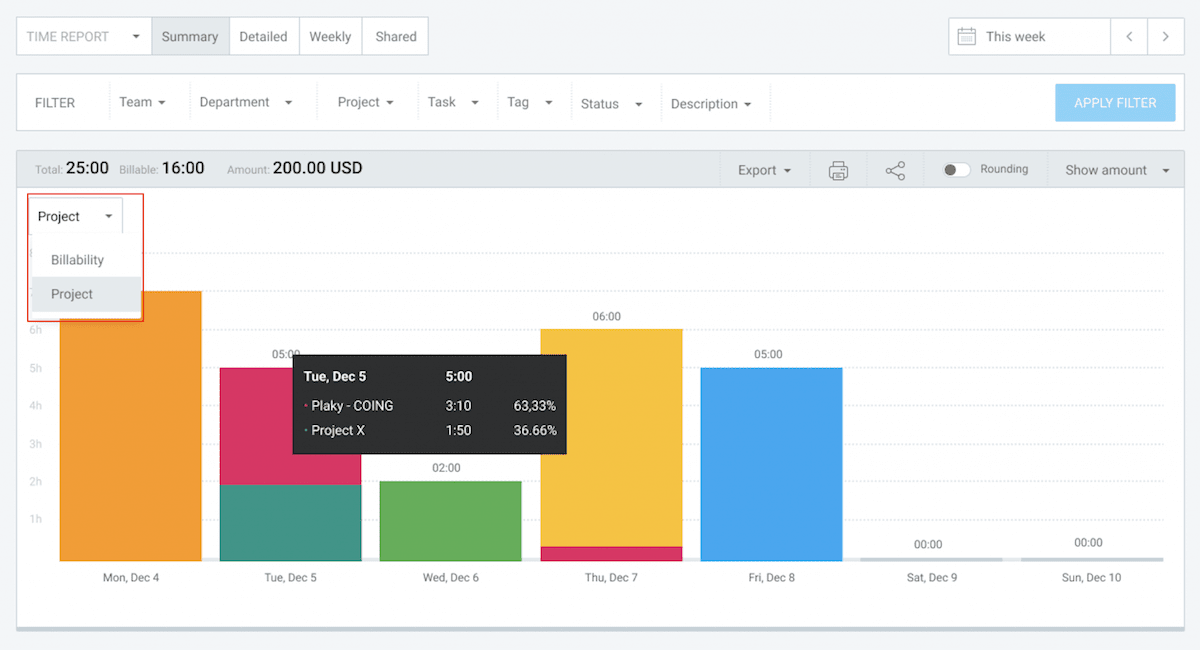
The summary report shows how much time your team spent on every project and task. For a more detailed breakdown of tasks per employee, you can also check out the assignments report.
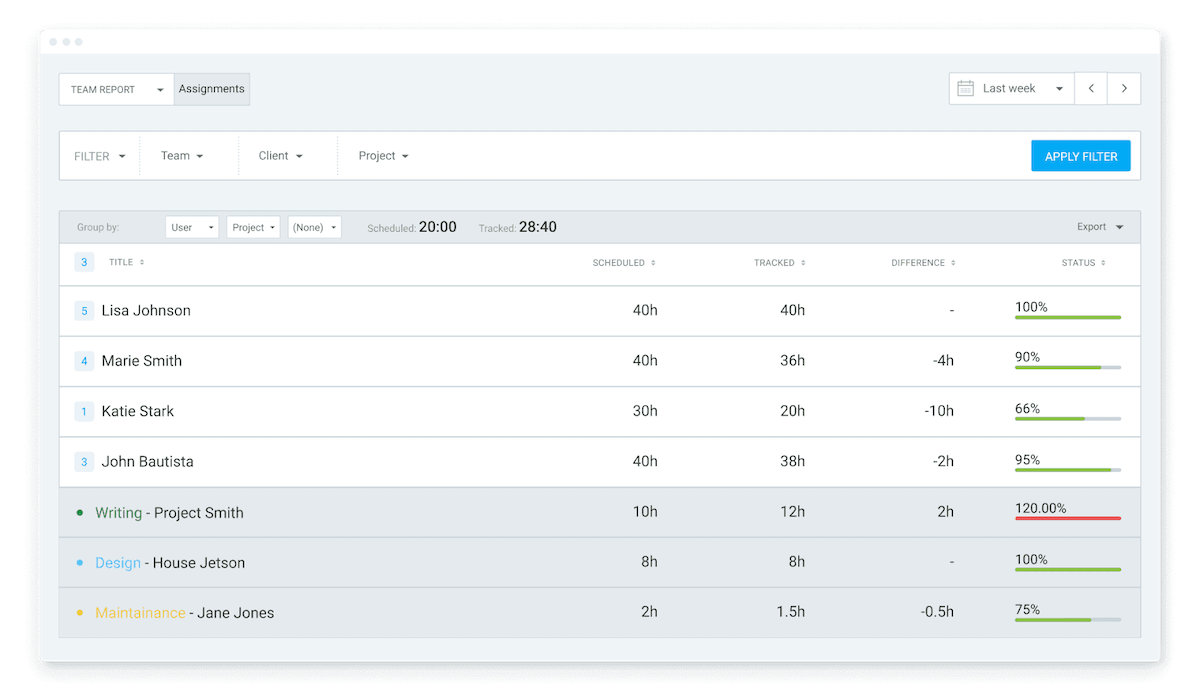
In the assignments report, you can easily see:
- Time everyone spends on their tasks,
- Comparison between project estimates and tracked time, and
- Progress bar for each task.
Clockify updates these reports in real time, so you can always check your progress towards KPIs.
💡 CLOCKIFY PRO TIP
Need help tracking staff performance? Check out our detailed guide with useful tips and templates:
Step #5: Define your KPIs
Now, you have all the information you need to define your KPIs. Next, here’s the most common framework for writing any KPI:
Action + Detail + Value + Unit + Time frame
For our example, the finalized KPIs might look like this:
KPI #1: Track (Action) the number of tasks completed per employee (Detail) with a target of 10 (Value) tasks per employee (Unit) each week (Time frame).
KPI #2: Measure (Action) the average time to complete a task (Detail) each week (Time frame) with a target of under 2 (Value) hours per task (Unit).
Step #6: Track and adapt your KPIs
Now that you’ve clearly defined your KPIs, all that’s left to do is to track them. Depending on the specifics of your goals, you can track them weekly, biweekly, monthly, quarterly, or yearly.
Just remember that there’s no such thing as a fixed goalpost in business. As your company evolves, KPIs should evolve and change accordingly. Only track KPIs that make sense based on current performance and long-term strategy (and make changes if necessary).
CEO Jensen Savage believes everyone should reevaluate KPIs regularly:
“KPIs should be revisited quarterly at a minimum, or immediately after any major change in business goals, structure, or market conditions. A strategic pivot must always be accompanied by reevaluating KPIs to ensure they are closely aligned with decisions.”
Key performance indicators examples
Now that you know the basics of setting KPIs, we’ll provide specific KPI examples across different industries and departments.
Example #1: SaaS KPIs
Below are 4 KPIs that SaaS companies often monitor to gauge performance:
- Monthly Recurring Revenue (MRR) tracks your company’s monthly recurring revenue as a growth indicator,
- Quick Ratio compares your startup’s revenue gains and losses using the Quick Ratio from balance sheets,
- Net Burn Rate measures how quickly your startup is spending its venture capital compared to monthly revenue, and
- Net MRR Growth measures the monthly growth rate of your net recurring revenue.
For some specific examples of these KPIs, check out the table below:
| KPI | Example Target |
| Monthly Recurring Revenue | $40,000 MRR |
| Quick Ratio | $50,000 in quick assets / $10,000 in current liabilities = Quick Ratio of 5 |
| Net Burn Rate | $40,000 overhead – $10,000 revenue = $30,000 net burn |
| Net MRR Growth | ($5,000 in March – $4,000 in April) / $4,000 × 100 = 25% Net MRR Growth |
Example #2: Digital marketing KPIs
Here are some of the most common digital marketing KPIs:
- Conversion Rate measures the percentage of users who complete a specific action, like signing up for a newsletter or purchasing a product,
- Monthly Revenue compares this month’s revenue with the previous month’s, focusing on size and growth rate, and
- Monthly Traffic Sources tracks the number of sessions from organic traffic, direct traffic, and referrals during the current month.
Specific KPI examples are available in the table below:
| KPI | Example Target |
| Conversion Rate | Out of 1,000 website visitors, 50 purchase your product = 5% conversion rate |
| Monthly Revenue | $80,000 revenue with a 15% growth rate compared to the previous month’s revenue |
| Monthly Traffic Sources | 20,000 sessions via organic search and 5,000 sessions via direct search |
Here’s how CEO Jensen Savage helps her clients focus on the right digital marketing KPIs:
“One of my clients in the med spa industry shifted their focus from ‘leads generated’ to ‘consultations booked per week.’ That subtle shift reframed how their team viewed business success and helped improve their lead-to-close rate by over 40% in 90 days.”
Example #3: SEO marketing KPIs
Next, we have some SEO KPIs you can track:
- Keyword Click-Through Rate (CTR) measures how often users click on your page compared to how often it’s shown in search engine results,
- Content Backlog tracks the number of content pieces that are waiting to be published, and
- Pageviews measures the number of views individual pages on your website receive.
See the table below for examples of specific KPI targets:
| KPI | Example Target |
| Keyword Click-Through Rate (CTR) | 5% CTR |
| Content Backlog | 10 unpublished blog posts |
| Pageviews | 1,000 pageviews per month |
Example #4: Social media marketing KPIs
Social media marketers often estimate their performance with these KPIs:
- Social Events measures user engagement, like retweets on X or shares on Instagram,
- Social Sentiment tracks if the brand is mentioned on social media in a positive, negative, or neutral light, and
- YouTube Channel Subscribers counts the number of YouTube users who subscribe to your channel.
Here are some specific examples:
| KPI | Example Target |
| Social Events | Average of 150 likes and 10 shares per Instagram post |
| Social Sentiment | 75% of positive tweetsUnder 5% of negative tweetsUnder 20% of neutral tweets |
| YouTube Channel Subscribers | 50,000 subscribers |
Example #5: Email marketing KPIs
Here are some KPIs you can track in email marketing:
- Email subscribers — the number of users who subscribe to your email list,
- Unsubscribers — the number of subscribers who unsubscribe from your emails, and
- Email forwards — the number of times subscribers forward your emails to others.
Check out this table for specific examples of those KPIs:
| KPI | Example Target |
| Email Subscribers | 10,000 subscribers |
| Unsubscribers | Fewer than 20 unsubscribers per month |
| Email Forwards | 20 forwards per month |
Example #6: Sales KPIs
To see if you’re likely to meet your sales targets, track some of these KPIs:
- Sales Growth measures your team’s ability to increase revenue during a set period,
- Potential New Customers tracks the number of leads your team has contacted,
- Sales Conversion Rate measures how effectively you turn leads into customers,
- Sales per Rep tracks individual performance by measuring revenue per rep,
- Sales by Department compares departments by the revenue they generate, and
- Sales Cycle Duration measures how long it takes to close a sales deal.
Examples of sales KPI targets include:
| KPI | Example Target |
| Sales Growth | 30% per month |
| Potential New Customers | 500 new customers per month |
| Sales Conversion Rate | 7% of leads |
| Sales per Rep | $1,000 per rep |
| Sales by Department | $10,000 by department |
| Sales Cycle Duration | 1 hour |
Example #7: Finance KPIs
These financial KPIs help you analyze operations and track business performance:
- Current Ratio shows the ability of your organization to cover all short-term financial obligations within one year,
- Working Capital reflects your organization’s capacity to cover short-term liabilities using available assets,
- Vendor Expenses tracks the total payments owed to external vendors,
- Net Profit Margin measures the profit your organization makes on each dollar of revenue, and
- Gross Profit Margin measures the profit remaining from each dollar of sales before expenses.
Here’s how specific targets for finance KPIs look in practice:
| KPI | Example Target |
| Current Ratio | $150,000 in current assets / $50,000 in liabilities = ratio of 3 |
| Working Capital | $150,000 – $50,000 = $100,000 in positive working capital |
| Vendor Expenses | $30,000 per quarter |
| Net Profit Margin | 15% of revenue |
| Gross Profit Margin | 60% of revenue |
Example #8: Customer support KPIs
You can monitor support efficiency and client satisfaction with the following KPIs:
- Support Requests tracks the number of incoming customer requests over a specific period,
- Time per Ticket tracks the average time spent by an agent resolving a single ticket,
- Tickets Handled on Time tracks the number of tickets resolved within a target time,
- Talk Time measures the length of individual support calls, and
- Speed of Answer shows how quickly support staff respond to incoming calls.
See some examples of targets for sales KPIs and call center KPIs in the table below:
| KPI | Example Target |
| Support Requests | Fewer than 500 requests per month |
| Time per Ticket | 15 minutes per ticket |
| Tickets Handled on Time | 100 tickets within 15 minutes each |
| Talk Time | 5 minutes per customer call |
| Speed of Answer | Less than 20 seconds on average |

FAQs about KPI metrics
Now that we’ve covered basic KPIs across different departments and industries, we’ll answer some of the most common questions about key performance indicators.
Do KPIs really work?
Yes, KPIs do work. Besides measuring performance against goals, you can use KPIs to:
- Clarify where the organization currently stands and future performance expectations,
- Serve as a reference point for comparing past and present results,
- Highlight what matters most in the business, helping employees stay focused,
- Establish consistent steps to reach goals,
- Increase employee accountability by defining good and poor performance,
- Optimize resource usage and reduce inefficiencies, and
- Strengthen employee connection to the company’s overall mission.
What are the 4 Ps of KPI?
The 4 Ps of KPI are a useful reminder of factors you should consider when deciding which KPIs to track. They are:
- Purpose — showing why you’re measuring the KPI in the first place,
- Performance — highlighting the specific activity or outcome you’re evaluating,
- Process — detailing the specific method of tracking KPIs, like data collection tools or specific formulas, and
- People — identifying the person or team responsible for tracking the KPI.
When you define a new KPI, it should have a clear answer to each of the four Ps.
How to identify indicators?
To identify the best KPIs for your business, find indicators that:
- Align with your business goals,
- Fit the size and type of your business,
- Show insights to help make better decisions, and
- Provide an action plan for achieving your goals.
Only track indicators that are specific to your business and market position.
What is the difference between KPI and OKR?
OKRs, or Objectives and Key Results, are a goal-setting framework that people often confuse with Key Performance Indicators.
Here’s the difference — KPIs measure the process of your efforts, while OKRs focus on the outcome of those efforts.
For a practical example, suppose your KPI target is to reply to each support ticket within 15 minutes. However, your time tracking reports show it actually takes 20 minutes.
Based on this, you could set the following Key Result: I will decrease the time I spend on one support ticket from 20 minutes to 15 minutes within 2 weeks.
Track productivity with Clockify by CAKE.com
As you’ve probably noticed from our KPI examples, most KPIs boil down to 2 essential metrics for any business — time and budget.
In highly competitive industries, you don’t have all the time in the world to improve performance against other companies or an unlimited budget.
To stay aligned with your business goals, use a powerful goal tracker like Clockify to:
- Track time spent on each project and task,
- Set budget estimates and deadlines for your goals,
- Monitor progress to see when you need to course-correct, and
- Get visual reports on your goals automatically.
To track project progress in Clockify, simply go to the Projects tab and open the Tasks section for a specific project. From there, you can manage goals, timelines, and budgets in one place.
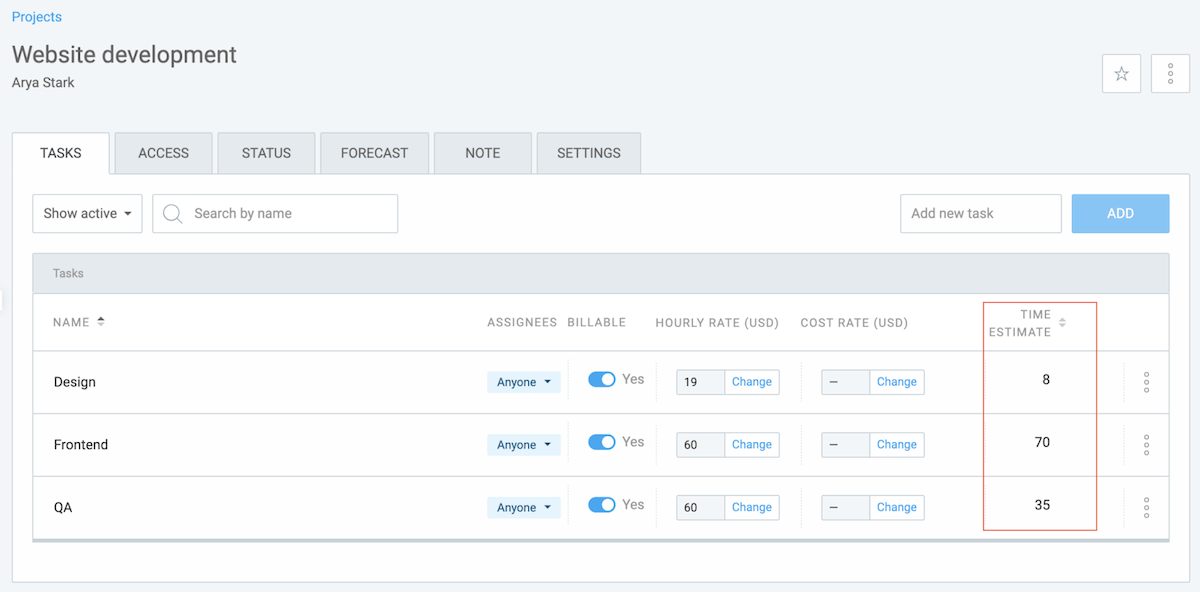
You can easily set an estimate for each task associated with the project. In the Settings tab, you can also set an overall time or budget estimate for the entire project.
Once you set estimates, Clockify automatically measures your progress towards those goals.
In the Status tab for each project, you can see a visual representation of your progress in real time. This view shows if you’re on track or falling behind:
Defining KPIs is just step one. To hit your goals, you need clarity and constant accountability.
Clockify by CAKE.com delivers both by monitoring performance in real time and giving clear visual insights into your progress.