Average PTO in the USA: 2026 Statistics and Trends
Most employees say paid time off matters, but many don’t actually use it.
So, why do workers refrain from using PTO? Are companies doing enough to get employees to take time off?
Find out the answers to these questions, the average PTO in the USA, paid leave access rates, and more in this guide.

PTO statistics: 10 important stats
PTO (or the time you take off from work without any loss of pay) is a common benefit that contributes to millions of workers around the world feeling valued, healthy, and well-rested.
Let’s take a look at 10 highlighted PTO statistics:
- 85% of employees state that taking time off boosts their happiness.
- 68% of employees get anxiety if they don’t check work-related messages while on vacation.
- 61% of employers offer a PTO accrual plan based on hire date.
- 59% of employees feel uneasy when they have to ask for some time off.
- 57% of workers say their company loyalty drops after having a poor leave experience.
- 43% of Millennials take time off solely to catch up on sleep and rest.
- 23% of people didn’t take a single day off during the past year.
- 11 days after 1 year of service is the average vacation time for civilian and private industry employees.
- More than 95% of employees in the management, business, and finance sectors have access to paid leave.
- 20 days of PTO — that’s how much most European countries offer at a minimum.
How much PTO does the average American get?
Federal law does not require employers to offer any paid time off to their employees. Therefore, PTO is a matter of the employment contract.
The average PTO days in the USA depend on various factors, the most important being:
- Type of service (civilian, private industry, or government),
- Years of service, and
- PTO plan type (consolidated vs. separate policies).
A consolidated leave plan bundles all types of leaves into one policy. On the other hand, some employers use separate leave policies for:
- Sick leave,
- Personal time off,
- Vacation leave, and
- Family and medical leave.

The average PTO in the USA for consolidated leave plans
According to the US Bureau of Labor Statistics, here’s the average paid time off in the US for civilian and private industry employees with consolidated leave plans per year:
- 14 days after 1 year of employment,
- 18 days after 5 years of service,
- 20 days after 10 years of work, and
- 23 days after 20 years of service.
Government workers with consolidated leave plans get:
- 18 days after 1 year,
- 21 days after 5 years,
- 24 days after 10 years, and
- 27 days after 20 years.
The average PTO and sick days in the USA for separate leave plans
According to the US Bureau of Labor, the average civilian employee with a separate sick leave plan gets a total of 8 paid sick days per year, regardless of years of service.
An average private industry worker has 7 paid sick days per year, no matter how long they’ve been employed.
On the other hand, the average number of paid sick days for government workers highly depends on the years of service. Government employees receive an average of:
- 11 sick days per year after 1 year of employment, and
- 12 sick days per year after 5 years of employment.
🎓 Paid Sick Leave Laws by State Guide for 2025
The average vacation time in the US for separate leave plans
The average vacation time in the USA per year (as a separate leave plan) also depends on the type of service and years of employment.
The US Bureau of Labor Statistics report shows how many days of vacation per year private industry employees typically get:
- 11 days per year after 1 year of service,
- 15 days per year after 5 years of service,
- 18 days per year after 18 years of employment, and
- 20 days per year after 20 years of service.
The average vacation days per year for state or local government workers also depend on the years of service:
- 13 days per year after 1 year,
- 16 days per year after 5 years,
- 19 days per year after 10 years, and
- 22 days per year after 20 years of service.

What percentage of Americans have PTO? Paid leave access statistics
Let’s see the percentages of private-sector employees, civilian employees, and government workers who had access to paid vacation, sick days, and holidays.
Access to paid vacation
The latest US Bureau of Labor numbers show that 80% of private-sector employees had paid vacation available in 2025. Furthermore, 77% of civilian workers were offered paid vacation that same year.
The number is much lower for government workers, as only 61% of government employees had paid vacation leave available.
Access to paid sick days
Paid sick leave is a crucial government benefit, as 93% of government employees have access to paid sick days.
Moreover, 82% of civilian workers and 80% of private-sector employees had paid sick leave available in 2025.
Access to paid holidays
The same US Bureau of Labor numbers indicate that 80% of civilian workers had access to paid holidays in 2025.
On the other hand, 81% of private industry workers had access to paid holidays, which is significantly higher compared to 68% of government employees with the same benefit.
Let’s look into paid leave access statistics for different categories of workers in more detail.
🎓 What Are Paid Holidays and How Do They Work?
Employees in larger companies receive more PTO benefits
Data from the BLS’s 2025 Employee Benefits Survey shows that employees of larger companies are more likely to have access to PTO benefits.
This table shows the percentage of workers who have access to PTO benefits depending on the size of the business they work at:
| Company size | Vacation | Holiday | Sick leave |
| 1–49 employees | Civilian: 71% Private: 71% Government: 65% |
Civilian: 73% Private: 73% Government: 69% |
Civilian: 73% Private: 73% Government: 87% |
| 50–99 employees | Civilian: 73% Private: 76% Government: 45% |
Civilian: 72% Private: 74% Government: 55% |
Civilian: 77% Private: 75% Government: 92% |
| 100–499 employees | Civilian: 83% Private: 87% Government: 60% |
Civilian: 87% Private: 90% Government: 68% |
Civilian: 88% Private: 87% Government: 92% |
| 500+ employees | Civilian: 83% Private: 91% Government: 63% |
Civilian: 86% Private: 93% Government: 70% |
Civilian: 91% Private: 90% Government: 94% |
Full-time workers are more likely to get PTO benefits
The same Employee Benefits Survey showed that full-time employees are more likely to receive PTO benefits when compared to part-time workers.
Here’s the percentage of workers with access to vacation, sick, and holiday leave (the survey offers no data for personal leaves), depending on the type of employment:
| Employment type | Vacation | Holiday | Sick leave |
| Full-time | Civilian: 89% Private: 93% Government: 66% |
Civilian: 89% Private: 92% Government: 73% |
Civilian: 90% Private: 88% Government: 99% |
| Part-time | Civilian: 38% Private: 40% Government: 23% |
Civilian: 49% Private: 50% Government: 34% |
Civilian: 56% Private: 56% Government: 50% |
🎓 Part-Time vs. Full-Time Employment: Understanding the Difference
Union employees are more likely to receive PTO benefits
Union workers are more likely to receive PTO benefits, the same Employee Benefits Survey shows.
Take a look at the table that shows the percentage of union and non-union workers with access to vacation, sick, and holiday leave:
| Bargaining status | Vacation | Holiday | Sick leave |
| Union | Civilian: 75% Private: 91% Government: 58% |
Civilian: 81% Private: 94% Government: 69% |
Civilian: 92% Private: 86% Government: 98% |
| Non-union | Civilian: 78% Private: 79% Government: 63% |
Civilian: 79% Private: 80% Government: 66% |
Civilian: 80% Private: 80% Government: 88% |
Higher-earning workers typically receive more benefits
The Employee Benefits Survey also showcased the discrepancy between higher and lower-earning workers in civilian and private industry sectors. The highest-earning workers in these sectors are more likely to receive benefits such as paid sick leave, paid vacation, and paid holidays.
Interestingly, government and civilian employees don’t follow the same pattern, as you can see from the table below. It seems that the highest-earning 25% actually receive less paid vacation and holidays.
| Earnings | Vacation | Holiday | Sick leave |
| Lowest-earning occupations (25%) | Civilian: 57% Private: 55% Government: 58% |
Civilian: 62% Private: 61% Government: 66% |
Civilian: 61% Private: 58% Government: 81% |
| Second lowest-earning occupations (25%) | Civilian: 84% Private: 84% Government: 86% |
Civilian: 85% Private: 85% Government: 88% |
Civilian: 84% Private: 83% Government: 96% |
| Third lowest-earning occupations (25%) | Civilian: 89% Private: 91% Government: 58% |
Civilian: 89% Private: 90% Government: 67% |
Civilian: 91% Private: 88% Government: 98% |
| Highest-earning occupations (25%) | Civilian: 83% Private: 93% Government: 44% |
Civilian: 85% Private: 94% Government: 53% |
Civilian: 95% Private: 94% Government: 96% |
Access to PTO isn’t the same in every industry
According to the US Bureau of Labor Statistics, not all employees have access to paid leave benefits. The numbers vary greatly between industries.
Here’s the percentage of workers who had access to paid leave (sick leave, vacation, and holidays):
| Industry | Vacation | Holiday | Sick leave |
| Management, business, and finance | Civilian: 96% Private: 97% Government: no data |
Civilian: 95% Private: 96% Government: no data |
Civilian: 96% Private: 96% Government: no data |
| Installation, maintenance, and repair | Civilian: 91% Private: 90% Government: no data |
Civilian: 93% Private: 93% Government: no data |
Civilian: 83% Private: 82% Government: no data |
| Office and administration | Civilian: 88% Private: 88% Government: 86% |
Civilian: 90% Private: 90% Government: 88% |
Civilian: 88% Private: 88% Government: 93% |
| Production and transportation | Civilian: 87% Private: 88% Government: 64% |
Civilian: 88% Private: 89% Government: 74% |
Civilian: 80% Private: 79% Government: 92% |
| Construction, extraction, farming, fishing, and forestry | Civilian: 78% Private: 76% Government: no data |
Civilian: 82% Private: 80% Government: no data |
Civilian: 72% Private: 69% Government: no data |
| Sales | Civilian: 69% Private: 69% Government: no data |
Civilian: 80% Private: 80% Government: no data |
Civilian: 72% Private: 72% Government: no data |
| Education | Civilian: 20% Private: no data Government: 12% |
Civilian: 32% Private: no data Government: 25% |
Civilian: 98% Private: no data Government: 100% |
Employees in the Western USA are most likely to have PTO
The same US Bureau of Labor Statistics shows differences in paid leave access based on employees’ region. Take a look at the percentages of employees who had access to paid vacation, holidays, and sick leave.
| Region | Vacation | Holiday | Sick leave |
| Western US | Civilian: 78% Private: 80% Government: 65% |
Civilian: 80% Private: 81% Government: 72% |
Civilian: 94% Private: 94% Government: 95% |
| Northeastern US | Civilian: 76% Private: 79% Government: 57% |
Civilian: 80% Private: 83% Government: 63% |
Civilian: 89% Private: 88% Government: 91% |
| Southern US | Civilian: 77% Private: 79% Government: 61% |
Civilian: 79% Private: 80% Government: 68% |
Civilian: 73% Private: 70% Government: 93% |
| Midwestern US | Civilian: 78% Private: 81% Government: 57% |
Civilian: 80% Private: 82% Government: 65% |
Civilian: 77% Private: 76% Government: 90% |
Now that we understand different leave access rates for vacation, sick leave, and holidays, let’s move on to the PTO usage statistics to see how workers utilize their average PTO days in the USA — and globally.

How employees use their time off: PTO usage statistics in the US
Have you ever wondered how much employees value having paid time off? What about how often PTO is actually used in the United States?
Learn more about the typical PTO usage statistics in the US, as well as how work stress affects US vacation time.
59% of workers feel uncomfortable taking time off
A recent LiveCareer report on PTO culture that surveyed over 1,000 US employees found that 59% feel some form of unease when taking time off.
Reasons for this vacation anxiety include:
- Fear of falling behind,
- Missed opportunities, and
- Being judged for stepping away.
Additionally, 1 in 8 workers worry that taking a vacation will make them look less committed. At the same time, 8% of surveyed employees are afraid they’ll get laid off while they’re gone.
The pressure isn’t just internal either. 1 in 3 workers (33%) feel pushed not to use all their PTO, and 9% say their employer outright discourages it.
Another 49% state their company claims to support time off, but the workload makes it realistically impossible.
The data also reveals a striking gap between what workers get and what they actually take. While 45% receive more than 2 weeks of PTO per year, 47% plan to take less than a week off for their summer vacation.
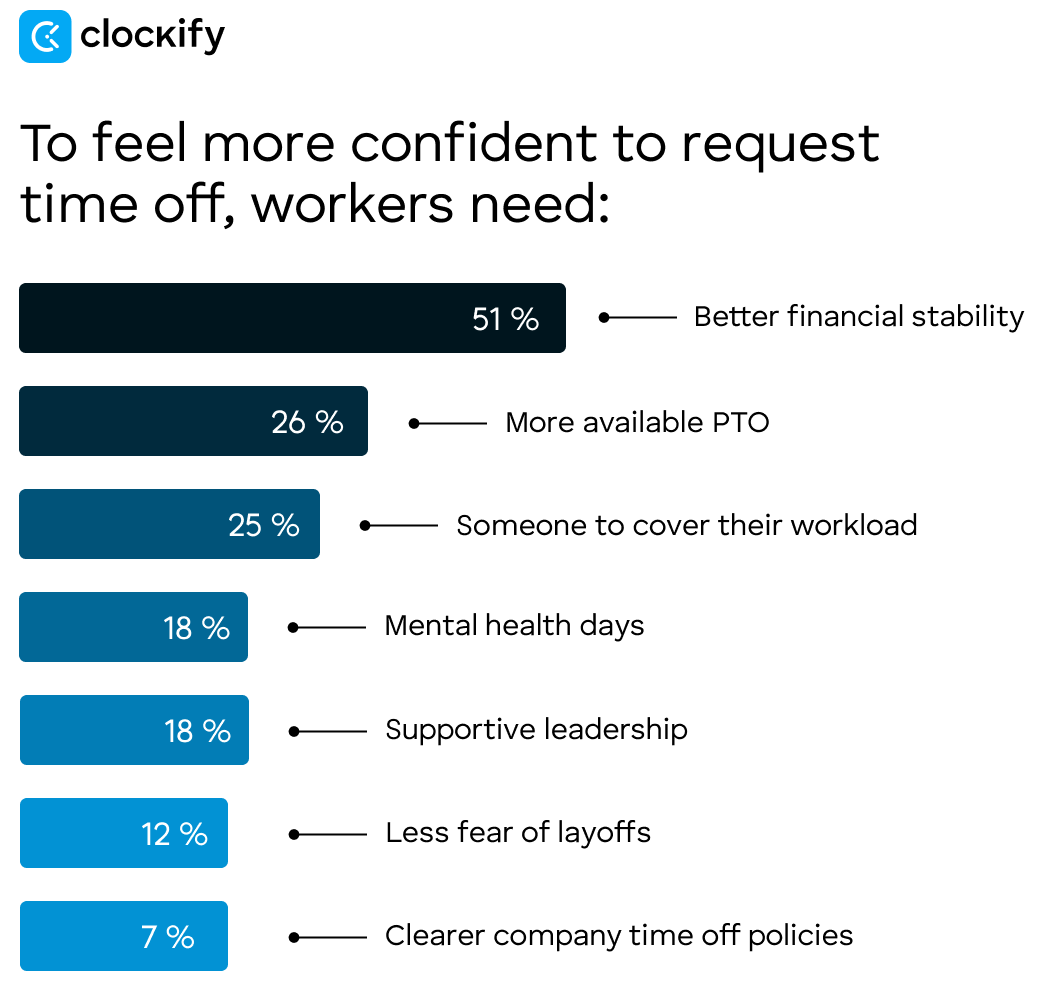
So, what would actually help? For starters, improved financial stability and more PTO could be the key to helping workers feel confident enough to log off.
23% of US employees took no PTO in the past year
According to the FlexJobs Work & PTO Pressure Report surveying over 3,000 workers, nearly 1 in 4 (23%) US employees didn’t take a single day off in 2025.
Even though most workers receive adequate time off, here’s how much they actually took in the past year:
- 21% took just 1–5 days,
- 21% took 6–10 days,
- 17% took around 2 weeks, and
- 18% took more than 15 days.
That said, trust at work is complicated. Namely, 82% of workers feel trusted to manage their responsibilities. But, when asked how their manager would react if they took a full week off and completely unplugged, only 24% expected an encouraging response. And 25% expected outright discouragement.
37% of workers use PTO to catch up on sleep
A recent Amerisleep survey of more than 1,200 US employees found that over a third of workers (37%) took paid time off in the past year specifically to rest — not to travel or run errands, just to catch up on sleep.
This trend was most noticeable among Millennials at 43%, followed by:
- Gen X — 34%
- Gen Z — 33%
- Baby Boomers — 20%
Taking time off to sleep carried into vacation habits, too — 35% of Millennials said they’ve taken an entire trip primarily to sleep and recover. Higher earners were also more likely to use PTO this way, and most who did kept it short (2–3 days).
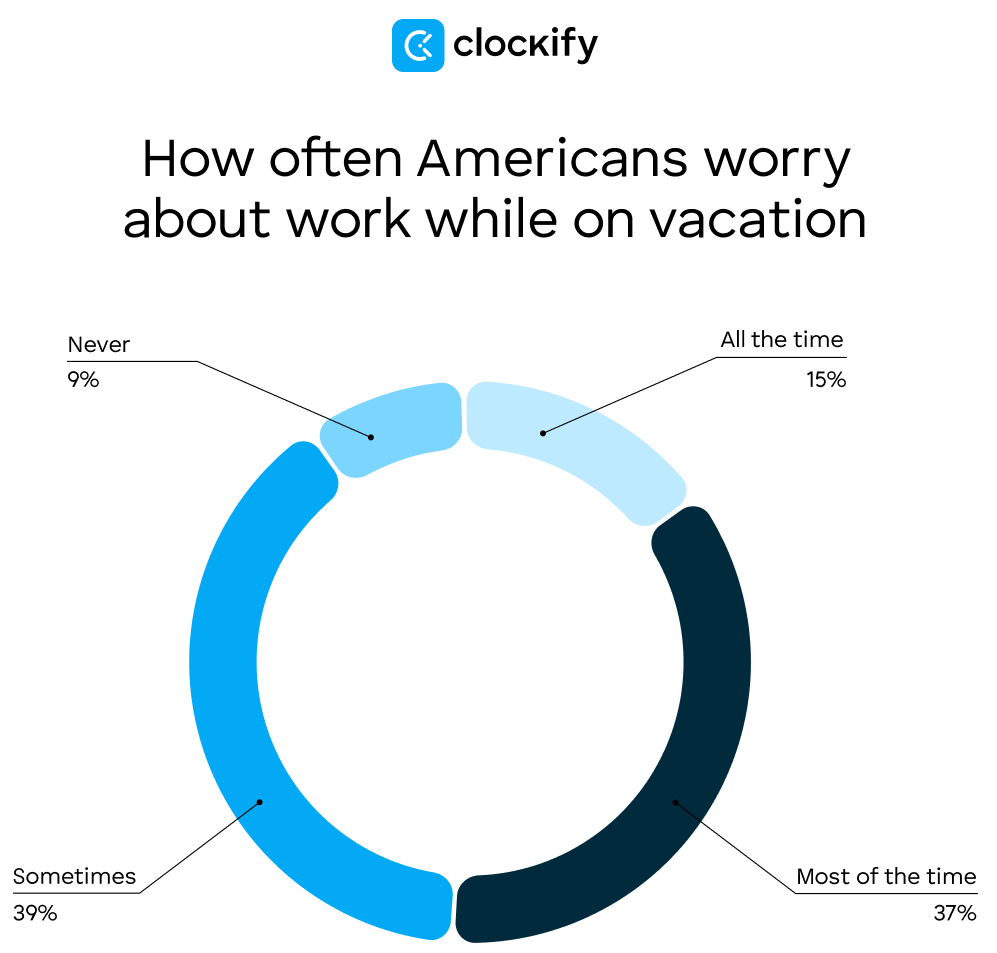
52% of Americans worry about work during vacation
Vacation days in America aren’t as enjoyable as they should be. Based on the vacations survey by Radical Storage, the majority of employees (52.3%) have work on their minds while on vacation, regardless of how many days of vacation per year they have.
Additionally, nearly 60% of respondents said they return from PTO to a noticeably more stressful workload all or most of the time.
The stress doesn’t disappear the moment they arrive at their destination, either. On average, it takes 3.5 days for workers to stop feeling stressed on vacation:
- 49.2% say it takes them 3–4 days to unwind,
- 27% need 5–7 days to relax,
- 17.2% manage to shake it off in the first 2 days, while
- 1.2% never fully let go of work stress.
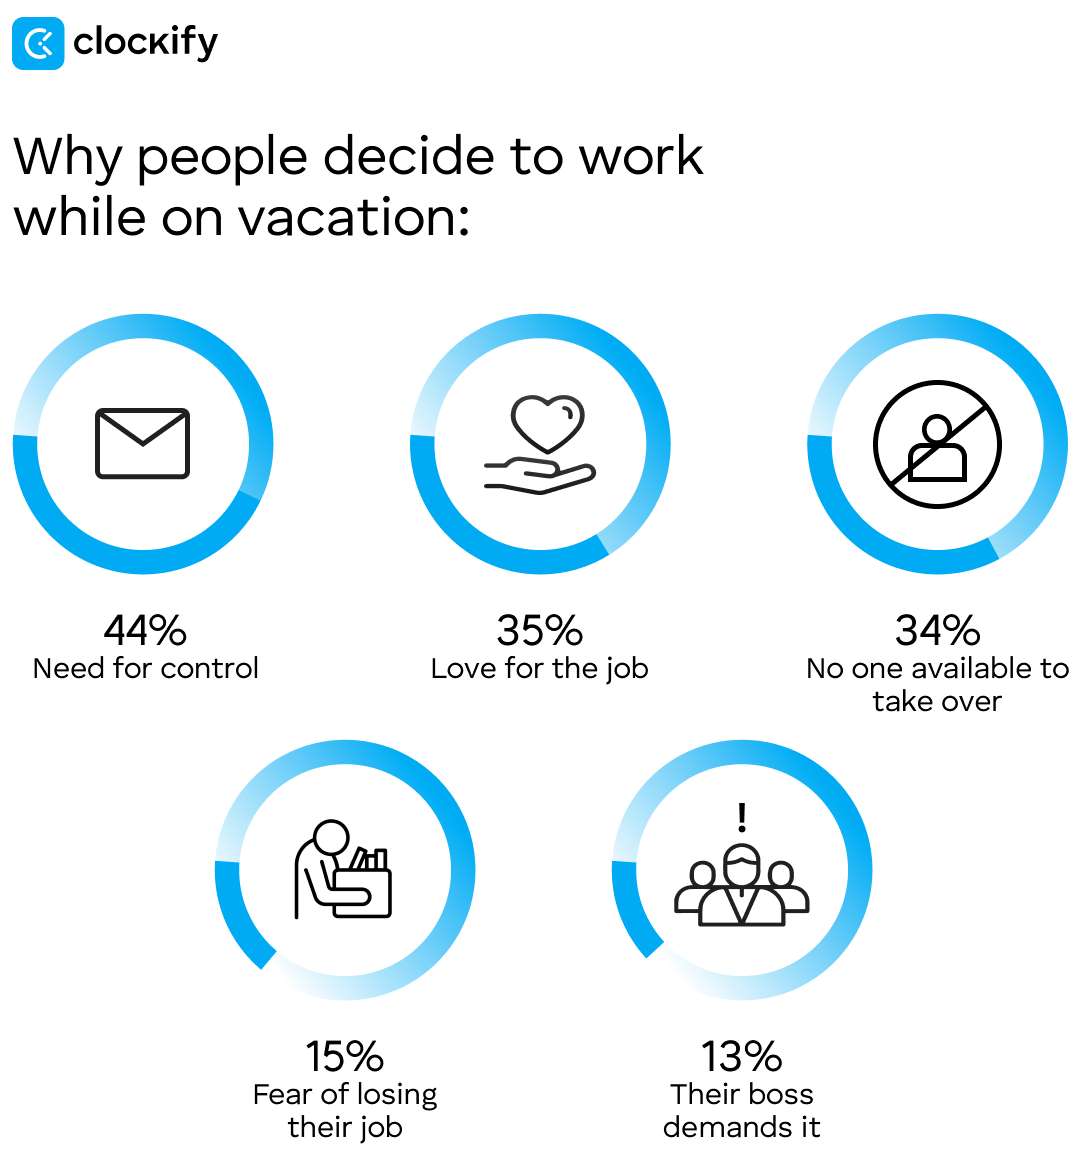
30% of employees occasionally work while on vacation
As Headway’s vacation survey of 2,000 workers reports, 30% of employees tend to work even during their time off, while 8% do so consistently.
Even more concerning, 68% of people get anxious on their vacation when they don’t check their work-related messages. Not to mention that 66% have issues disconnecting from work mentally.
This has led to 52% of respondents reporting problems with their mental health, such as depression and burnout. To make matters worse, 35% admit to having arguments with their partners because of it.
🎓 Mental Health Leave of Absence — Guide for 2024
57% of workers use all of their earned PTO
According to Bank of America’s 2025 Workplace Benefits Report, the average employee takes just over 3 weeks of PTO per year — enough, in theory, to recharge and reset. But only 57% of employees end up using all the PTO they’ve earned. Among those who don’t, just 51% say their manager actively encourages them to take it.
Employees who take the most PTO each year are also the most likely to report financial wellness, with 61% respondents saying so.
36% of workers start looking for a new job after poor leave experience
When employees have a poor leave experience, the fallout can be significant, the 2025 State of Leave and Accommodations report by AbsenceSoft reveals.
After going through a poor leave experience, more than a third (36%) of employees started looking for a new job. Also, 57% said they felt less loyal to their company afterward, while 42% came back less motivated.
On the other hand, a good leave experience benefits both employers and employees. After enjoying their time off:
- 55% of workers returned more motivated,
- 50% felt more productive, and
- 47% reported stronger loyalty to their workplace.
7% of employers actually offer unlimited PTO
Unlimited PTO makes a lot of headlines, which is why Bnchmrk collected data from various PTO policies across industries for their State of PTO report released in January 2026.
Namely, only 7% of employers offer unlimited or flexible PTO. The reality is that 48% of employers still use traditional accrual systems, and another 45% use combined PTO banks.
The catch is that unlimited PTO is largely a tech industry phenomenon — 32% of tech employers offer it. In healthcare and manufacturing, though? Zero.
So, if you’re a non-tech employer measuring your benefits package against Silicon Valley headlines, the comparison doesn’t hold up. Most workers aren’t in industries where unlimited PTO is even on the table — and benchmarking against companies that offer it can create a distorted picture of what’s actually standard.
6% fewer workers requested PTO in the past year
According to the recent BambooHR data, the proportion of employees requesting PTO dropped 6% in 2025. Approvals followed the same direction, falling to 7% over the past year.
As of February 2025, just 33% of US workers requested PTO, and only 16% got the green light. With a PTO approval rate of approximately 50%, North America takes the second lowest place, with Europe being the lowest (42%) in the world.
In terms of different industries, finance and nonprofit had the biggest number of time off requests (49% and 48% respectively), yet still saw relatively low approval rates. Healthcare was the worst offender as the only industry where approvals fell below 40%, landing at just 36%.
| Industry | Requested PTO | Approved PTO (of requested) |
| Finance | 49% | 47% |
| Nonprofit | 48% | 43% |
| Technology | 43% | 50% |
| Healthcare | 40% | 36% |
| Education | 35% | 48% |
| Construction | 32% | 54% |
| Travel/Hospitality | 22% | 47% |
| Restaurant, Food and Beverage | 15% | 54% |
6 extra PTO days could be all it takes to stop workers from quitting
A few extra days off can make the difference between an employee staying and walking out the door.
Essentially, research from Florida Atlantic University and Cleveland State University found that bumping PTO from just 1–5 days to 6–10 days significantly reduced resignations — particularly among men. Push that number to 11 or more days, and both men and women became less likely to quit.
The findings come from an 18-year longitudinal study published in the Journal of Strategy and Management, titled “Does one week now prevent 2 weeks notice later?” The answer, it turns out, is yes.
🎓 What Is Quiet Quitting: Definition, Origin, and Tips
20% of the USA states require PTO payout upon termination
Only 10 states legally require PTO payout after termination. But a staggering 82% allow companies to decide whether to pay for PTO depending on their employment agreement.
Most common PTO plans
According to the 2026 NFP US Leave Management Report, the most common approach ties accrual (how PTO is earned) to an employee’s hire date (61%). It’s the dominant model for a reason, as it gives organizations the flexibility to stay compliant with state-specific sick leave laws while still tailoring time-off structures to individual employees.
The simpler alternatives may be easier to administer, but they don’t always work when employment laws vary by state. Out of 796 respondents across industries and US states in this report, less common PTO plans were:
- Front-loaded plan where employees get all PTO at once at the beginning of the year (17%),
- Accrual based on the calendar year (14%), and
- Unlimited PTO (9%).
| PTO plan structure | Percentage of employers who offer this plan |
| Accrual plan based on hire date | 61% |
| Front-loaded plan | 17% |
| Accrual plan based on calendar year | 14% |
| Unlimited PTO plan | 9% |
What PTO benefits employees want to have?
But what kind of PTO plans would employees wish to be more competitive? These are the answers that NFP collected:
- PTO/vacation leave — 62%
- Parental leave — 54%
- Maternity leave — 49%
- Holidays — 47%
- Bereavement leave — 45%
- Sick leave — 37%
- Family caregiver leave — 32%
- Grandparental leave — 11%
- Menopause accommodations — 9%
Another study, 2025 Benefits & Beyond by Prudential, revealed that paid time off to care for a loved one is one of the most desired benefits. However, only 52% of employers offer it.
Namely, 1 in 3 employees who needed to take family or medical leave of at least 4 days — didn’t. The biggest barriers include:
- Affordability — 37%
- Fear of being judged by their employer — 33%
- Concerns about career advancement — 26%
- Not wanting to burden coworkers with extra work — 26%
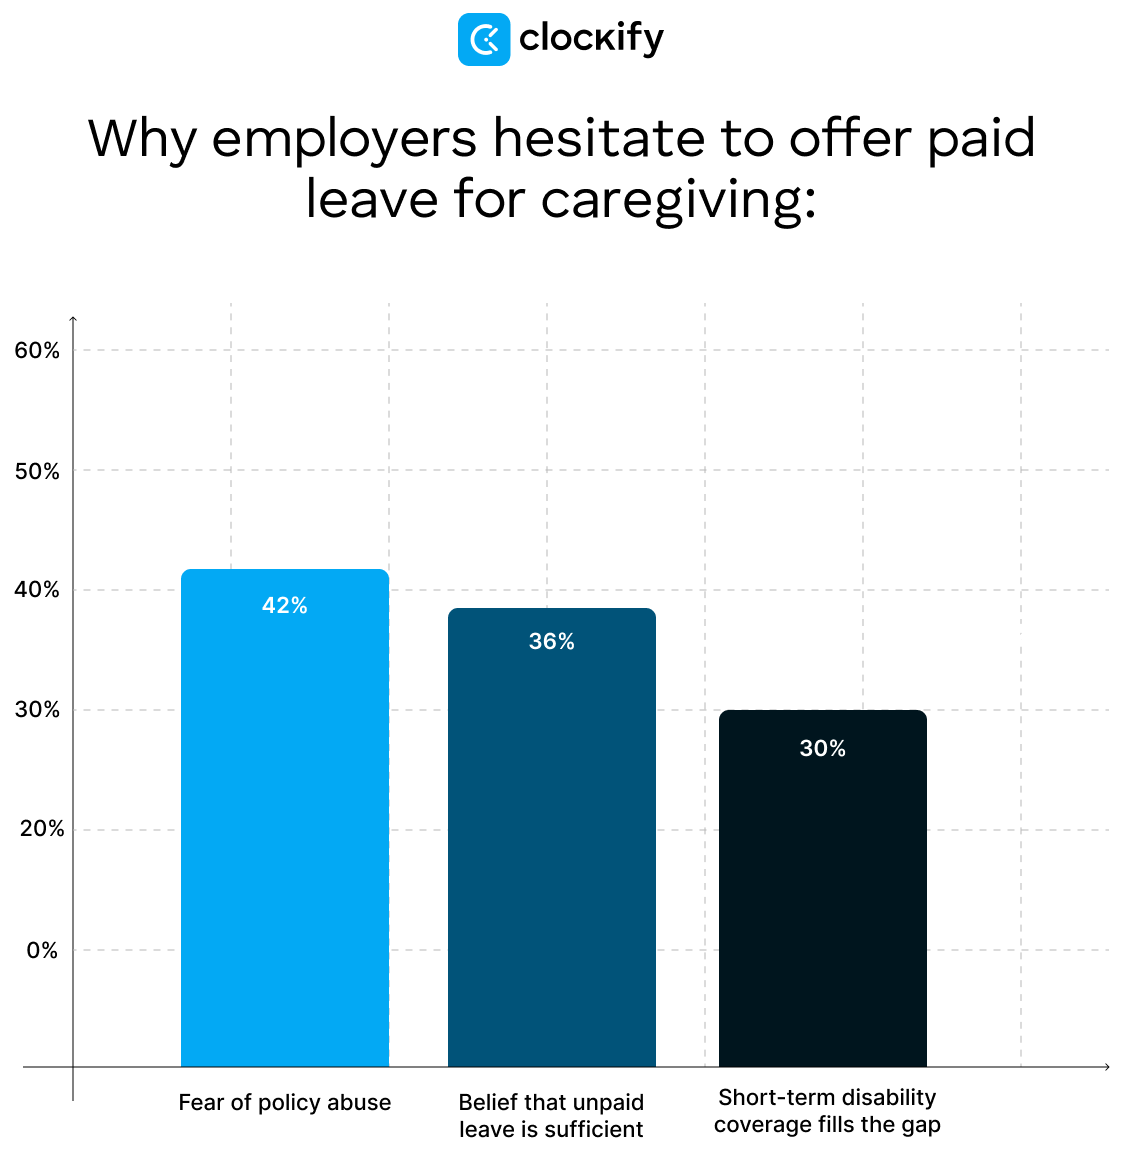
Even though 69% of employers recognize the value of paid leave for caregiving and the positive business impact of it, they still have reservations due to fear of policy abuse and financial pressure.
A recent Empower study on PTO asked employees about their PTO preferences, and these were the results:
- 85% of employees claim that vacation increases their happiness.
- 51% of the employees schedule their PTO days around public holidays.
- 46% of employees would donate their PTO days to a colleague who needs them.
- 32% of Americans use their PTO to head straight to destinations where they might retire.
- 26% of workers would apply for a lower-paying job to have unlimited PTO.
- 16% of workers wouldn’t accept a job without a 4-day workweek.
- 11% of employees would accept a pay cut of $1,000 just to secure a 3-day weekend.
What are floating holidays?
Floating holidays give employees flexibility to take time off for occasions that matter to them personally. Unlike fixed holidays (like Christmas or New Year’s), floating holidays let workers choose when to use them.
Floating holidays help companies create more inclusive leave policies without adding numerous fixed holidays to the PTO calendar. They’re especially valuable in diverse workplaces where employees celebrate different cultural or religious events.
What’s the truth behind unlimited vacation policy?
Unlimited PTO sounds great — take as much time as you want, whenever you want. But the reality is more complicated.
How unlimited PTO works: With an unlimited vacation policy, there’s no cap on PTO days. Employees can theoretically take as much time off as they need, as long as they get their work done.
But here’s the catch — employees with unlimited PTO often take less time off than those with traditional accrual systems. Without a set number of days, workers:
- Don’t know what’s acceptable to take,
- Feel guilty taking time off,
- Worry about looking less committed than coworkers, and
- Have no baseline to know if they’re taking enough time off.
From a business perspective, however, an unlimited vacation policy eliminates vacation liability. When employees earn PTO, that unused time becomes a financial debt on the company’s books. On the other hand, with unlimited PTO:
- No accrued PTO shows up as a liability,
- No payout is required when employees leave, and
- It may reduce the administrative burden.
This accounting benefit is why many companies decide to switch to unlimited policies — not necessarily employee wellbeing.
What is mandatory leave?
Mandatory leave requires employees to take time off — whether they want to or not. While rare in most industries, mandatory leave serves important purposes in specific sectors. For example, in financial services and banking, mandatory leave is used to prevent fraud.
But, even outside banking, mandatory leave helps:
- Prevent employee burnout,
- Cross-train teams on different roles,
- Identify single points of failure,
- Ensure proper knowledge transfer, and
- Reduce PTO hoarding.
Now that we have an idea about the average PTO in the USA, let’s see how the rest of the world compares.
What is the average PTO around the world: Global PTO statistics
According to a paid leave analysis by Resume.io, these are the top 10 countries that offer the most paid leave days a year (including paid holidays) to employees:
- Iran — 53 days,
- San Marino — 46 days,
- Yemen — 45 days,
- Andorra — 44 days,
- Bahrain — 44 days,
- Bhutan — 44 days,
- Madagascar — 43 days,
- Niger — 43 days,
- Togo — 43 days, and
- Azerbaijan — 42 days.
Keep reading for more worldwide PTO statistics!
Paid leave days by country in Europe
European countries have set a minimum requirement of 20 paid vacation days per year, which have to be available to workers.
Still, the exact number of paid vacation days (excluding the paid holidays) by country can differ. Referring to the Resume.io analysis, we can learn that Moldova offers 28 paid vacation days, France 25, and the UK only 20 paid vacation days.
On the other hand, when you add paid holidays, European countries with the most leave days available in total are:
- Russia — 42 days,
- Georgia — 41 days,
- Iceland — 40 days,
- Moldova — 39 days,
- Austria, Malta, Scotland — 38 days, and
- France, Spain, Ukraine — 36 days.
Canadian workers usually have 2 weeks of paid leave
The number of available paid days in Canada varies from province to province.
But in most cases, Canadian employees are offered a minimum of 2 weeks of paid leave after 1 year of employment. After 5 years, workers typically have 1 more week of paid leave available.
In the Canadian province of Saskatchewan, employees get 3 weeks of leave after the first year of their employment.
Australians have 4 weeks of leave annually
When it comes to annual leave in Australia (also referred to as holiday pay), it’s available to both full-time and part-time workers.
Australian employees receive 4 weeks of paid leave for every year they work.
Some Asian countries’ minimum leave requirements go as low as 5 days
According to the statutory annual leave in China, Chinese workers have between 5 and 15 days off, depending on the length of service and how long they’ve been employed in the country.
Moreover, Japanese employees who worked at least 6 months for at least 80% of working days per year have 10 days of paid leave available.
In India, workers can have from 15 to 21 days of leave available per year, based on the Factories Act of 1948.

FAQs about average vacation time in the USA
Let’s now go over the most pressing questions you may have about the average PTO in the USA.
How much PTO is normal in America?
The standard PTO rate for American workers is 11 vacation days after 1 year of service in the private sector. This increases to 15 days after 5 years and 20 days after 20 years.
Total PTO (including sick days and holidays) typically ranges between 15 and 25 days per year for full-time employees, depending on tenure and employer.
Is PTO legally required in the USA?
No, PTO isn’t legally required in the US. Federal law doesn’t require employers to offer any paid time off. That said, PTO is a voluntary benefit determined by employment contracts.
What is the standard PTO rate?
The standard PTO rate depends on your industry and years of service. For example, on consolidated leave plans, with combined vacation and sick leave, this would amount to:
- After 1 year: 14–18 days,
- After 5 years: 18–21 days,
- After 10 years: 20–24 days, and
- After 20 years: 23–27 days.
Separate policies may offer different amounts for each type of leave.
🎓 11 Free PTO Policy Templates
How many sick days are normal in the US?
The average sick days per year in the US is 7–8 days for private sector employees with separate sick leave policies. Government workers get more — around 11–12 sick days per year.
In consolidated PTO plans, sick time is bundled with vacation, giving employees flexibility in how they use their total days off.
Is it better to have more PTO or higher pay?
Whether you favor more PTO or higher pay depends on your preferences.
The recent Randstad Workmonitor study found that, for the first time in the last 2 decades, employees value work-life balance more than pay (83% vs. 82%).
🎓 Work-Life Balance Statistics for 2025: Global Trends
Do Americans actually have 104 days of summer vacation?
No. The “104 days of summer vacation” refers to school summer break (popularized in the animated series Phineas and Ferb).
Typically, summer break for US students falls between May/June and August/September, and is approximately 8–12 weeks long. This doesn’t apply to working adults and their PTO.
Create PTO policies and track employee time off with Clockify by CAKE.com
Taking paid time off is essential for work-life balance and employee satisfaction. So, it’s important to create PTO policies that encourage workers to take time off.
Managing PTO shouldn’t feel like a full-time job, but for most HR managers, it does. After all, when leave isn’t properly tracked, problems multiply as you encounter:
- Compliance nightmares,
- Payroll errors,
- Liability issues,
- Talent loss, and
- Remote chaos.
You can simplify PTO management by opting for a PTO and vacation tracker such as Clockify. The app’s time off feature allows you to:
- Benchmark your PTO against industry standards with real data,
- Stay compliant across different state laws automatically,
- Eliminate “ghost” absenteeism with document approvals,
- Manage distributed teams from one dashboard, and
- Reduce vacation liability with automated caps and policies.
Clockify by CAKE.com allows employers to easily create a time off policy for their company and choose whether the policy applies to all employees or specific departments.
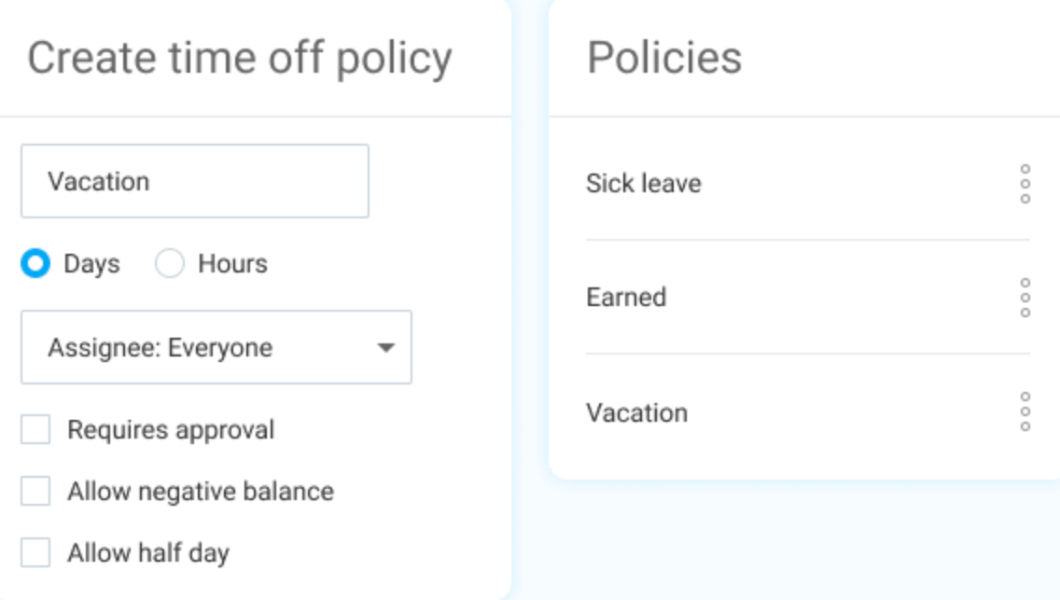
You can make a time off policy as specific as you want, as there are many options, such as:
- Sick leave,
- Vacation,
- Sabbatical,
- Family leave,
- Half-day,
- Business trip, and
- National holidays, etc.
Workers can then request time off and wait for approval from their supervisor. All employees may get an overview of everybody’s time off, which makes tracking and managing absence and workload much easier.
Whether you’re managing a small team or a large organization, Clockify helps you stay on top of PTO planning and employee attendance. It comes with 99,99% uptime and 24/7 full human support for all plans.