
Imagine being able to identify all the underlying causes of failure concerning your productivity, business, or personal matters.
As a matter of fact, you can — by employing a problem-solving technique that uses statistics to pinpoint issues causing most of the damage — the Pareto analysis.
But how does the Pareto analysis work?
To get to the bottom of this enigmatic principle, I tested the Pareto principle, too, and made sure I covered the following matters:
- What is the Pareto analysis?
- What is the Pareto analysis used for?
- Steps on how to conduct the Pareto analysis and create a Pareto chart,
- The pros and cons of the Pareto analysis,
- The Pareto principle and time management, and
- The overall rating of the Pareto analysis.
What is the Pareto analysis?
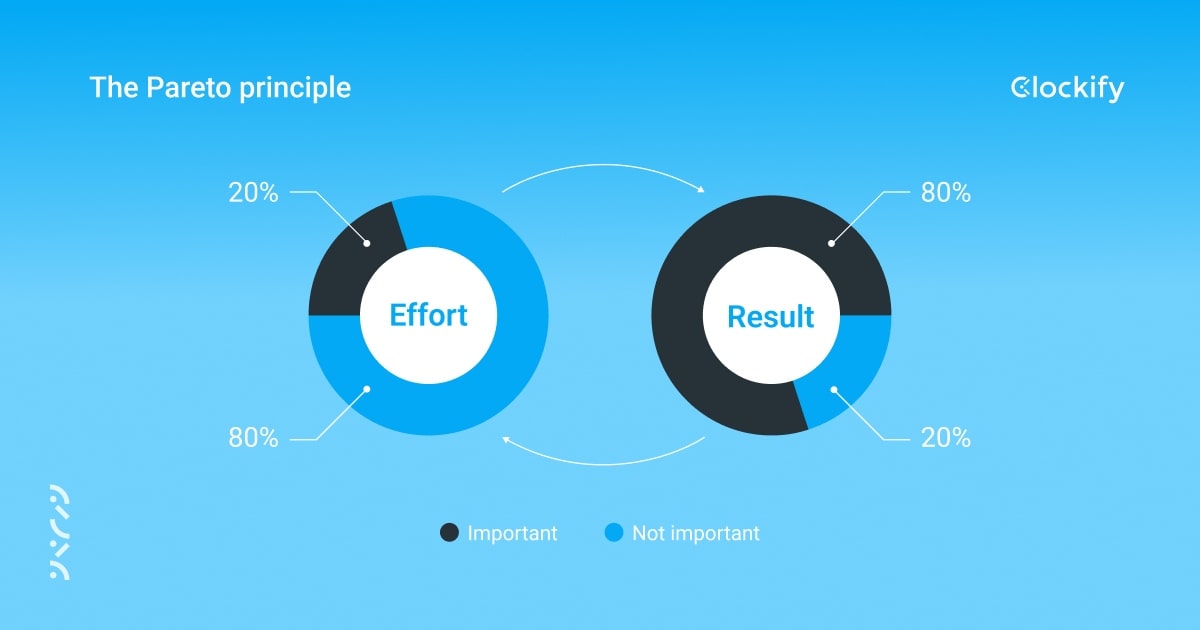
The Pareto analysis, or Pareto principle, is based on the 80/20 rule — 20% of the input results in 80% of the output. For instance, 20% of products are making 80% of a company’s profit.
The Pareto analysis helps single out the vital few that cause the trivial many. In other words, the Pareto analysis helps identify both issues or strengths that cause impact on something, whether business or personal life.
Originally, the Pareto analysis was established by Vilfredo Pareto in the late 19th century, who noticed that 80% of the land in all of Italy was owned by 20% of the population. He then started noticing similar patterns elsewhere. Later on, his research and work were adapted by Joseph M. Juran, a management consultant, and the Pareto principle and analysis were born.
In practice, with proper implementation of the Pareto analysis, individuals can use it to boost their personal productivity by focusing on the vital few or to help them prioritize their tasks.
On the other hand, companies can use this method to determine the most impactful problems or strengths related to their operations. For instance, when they are aware of the most relevant issues that cause most of the damage, they can act on them by concentrating on the solutions and allocating the right resources to solve those issues.
💡 Clockify Pro Tip
Make a clear distinction between productivity and efficiency by reading the following blog post on the matter, and also, learn how to calculate them to achieve better results:
Pareto analysis examples
Modern usages of the Pareto analysis further show that 80% of the problems within a project can often be traced back to 20% of the causes.
In other words, by focusing on the crucial 20% of the problem causes, you’ll subsequently be able to deal with the 80% of the issues that stem from them.
Let’s put this statement into perspective.
The Hard Rock Hotel conducted a guest survey and got 75 complaints in total, which were later grouped into 5 categories (room service, check-in issues, pool hours, minibar, and misc). It seemed like 20% of the guest complaint categories, room service and check-in issues, make up 80% of the total complaints.
This principle can be used in any other area of life, too:
- You wear 20% of your clothes 80% of the time.
- 80% of the air pollution comes from 20% of all factories in a city.
- 20% of the employees make 80% of a company’s profit.
- Only 20% of the students in a classroom have grades of 80% or higher.
💡 Clockify Pro Tip
Learn more about resource allocation and how to track it in this blog post:
How to make a Pareto chart (+ steps)
As explained above, the Pareto analysis can be your ally in sorting out problems and their impact on business operations (or your personal matters).
Now, take a look at the steps on how you can conduct the Pareto analysis and see what’s standing between you and success (I’ve also tested Pareto analysis and included my observations for better understanding).
Step #1: Collecting and grouping the issues
The first step in performing the analysis is forming a list of the issues that you want to evaluate. Whether it’s business or personal, create a list of the problems that will be your cornerstone for the future development of the analysis.
As a writer, I write huge blocks of text daily, and like any other job, mistakes are inevitable. When it’s time to review the text, a number of issues come to the surface, and I’ve collected and grouped some of the most frequent ones:
- Spelling mistakes — typos, misspelled words,
- Structural mistakes — unclear phrases, long headings, lack of transition words,
- Punctuation mistakes — run-on sentences, missing commas or quotation marks,
- Citation mistakes — missing references, outdated resources, or unnecessary citations,
- Formatting mistakes — different fonts used, double spacing, and
- Repeating mistakes — using certain words or phrases frequently.
Bear in mind that if the problems you discover concern your team too, you’ll need to include your team members in brainstorming potential issues.
💡 Clockify Pro Tip
Learn about the importance of team collaboration and effective strategies for building collaborative teams here:
Step #2: Identifying the causes
Now comes the hard part — i.e., the main point of the analysis.
This step requires you to think carefully and identify the root causes of an issue or issues at hand. Don’t forget that multiple underlying causes could be the main culprits for the ongoing issues.
To pinpoint your issues you could create a list of all the previously identified problems and connect them to the causes that may come to your mind.
For this purpose, I proofread one of my new texts and added up my writing mistakes, which totaled 98.
Look at the table below for a breakdown of problems, causes, and number of issues related to my writing:
| Problems | Possible causes | Number of occurrences |
|---|---|---|
| Structural mistakes | Lack of formal knowledge | 26 |
| Citation mistakes | Lack of formal knowledge | 21 |
| Repeating mistakes | Lack of focus | 17 |
| Spelling mistakes | Lack of focus | 15 |
| Formatting mistakes | Lack of time (tight deadlines) | 10 |
| Punctuation mistakes | Lack of time (tight deadlines) | 9 |
| Total number of problems occurred | 98 | |
The next step is to create the Pareto chart, where you will use your data to visually represent the connection between the total count of issues, their frequency, and final outcomes.
Step #3: Finalizing the Pareto chart
The Pareto chart contains bars showing problems, horizontal and vertical axes, together with a red line that represents the cumulative percentage of problems. The bars are shown in descending order, each representing an issue.
First, to get a graphical picture of the identified problems, you need to obtain the total count of the issues you’ve listed. In my case, that would be 98.
Then, you need to use a specific formula to obtain the exact percentages for each issue (to be able to represent the issues on a graph better):
(Frequency of occurrences) / (sum of total occurrences) * 100
In the substep below, we will use the above formula to calculate and determine each stop of your cumulative line on the chart.
Creating the cumulative line on your Pareto chart
Here’s how you will use the above formula to create the cumulative line on your chart.
So, the total count of all my issues is 98 — the sum of total occurrences.
I made Structural mistakes 26 times — that’s the frequency of my issue.
26 / 98 * 100 = 26,53%
Next, you need to create the route for each stop at your cumulative line.
Remember that the start of your cumulative line is at 26.53%.
To know the next stop of your cumulative line, you need to add up Structural mistakes with Citation mistakes, using the above given formula (the same formula that you will use to calculate each stop at your cumulative line) which is:
(26 + 21) \ 98 * 100 = 47,95%
Therefore, the 2nd stop of your cumulative line is at 47.95%.
The calculation for the 3rd stop is adding Structural, Citation, and Repeating mistakes:
(26 + 21 + 17) \ 98 * 100 = 65,30%
Your 3rd stop of the cumulative line is at 65,30%.
To know the 4th stop of your cumulative line, add up Structural, Citation, Repeating, and Spelling mistakes:
(26 + 21 + 17 + 15) \ 98 * 100 = 80,61%
The 4th stop of your cumulative line is at 80,61%.
Up next is the 5th stop, and add up Structural, Citation, Repeating, Spelling, and Formatting mistakes:
(26 + 21 +17 +15 +10) \ 98 * 100 = 90,81%
The 5th stop at your cumulative line is at 90,81%.
Your final, 6th stop requires you to add up all mistakes together — Structural, Citation, Repeating, Spelling, Formatting, and Punctuation mistakes:
(26 + 21 + 17 + 15 + 10 + 9) \ 98 * 100 = 100%
So, the last stop at your cumulative line is at 100%.
Now, let’s finalize the diagram by creating a y-axis (vertical axis) that represents the number of occurrences and drawing a straight, horizontal line (x-axis) that represents your mistakes.
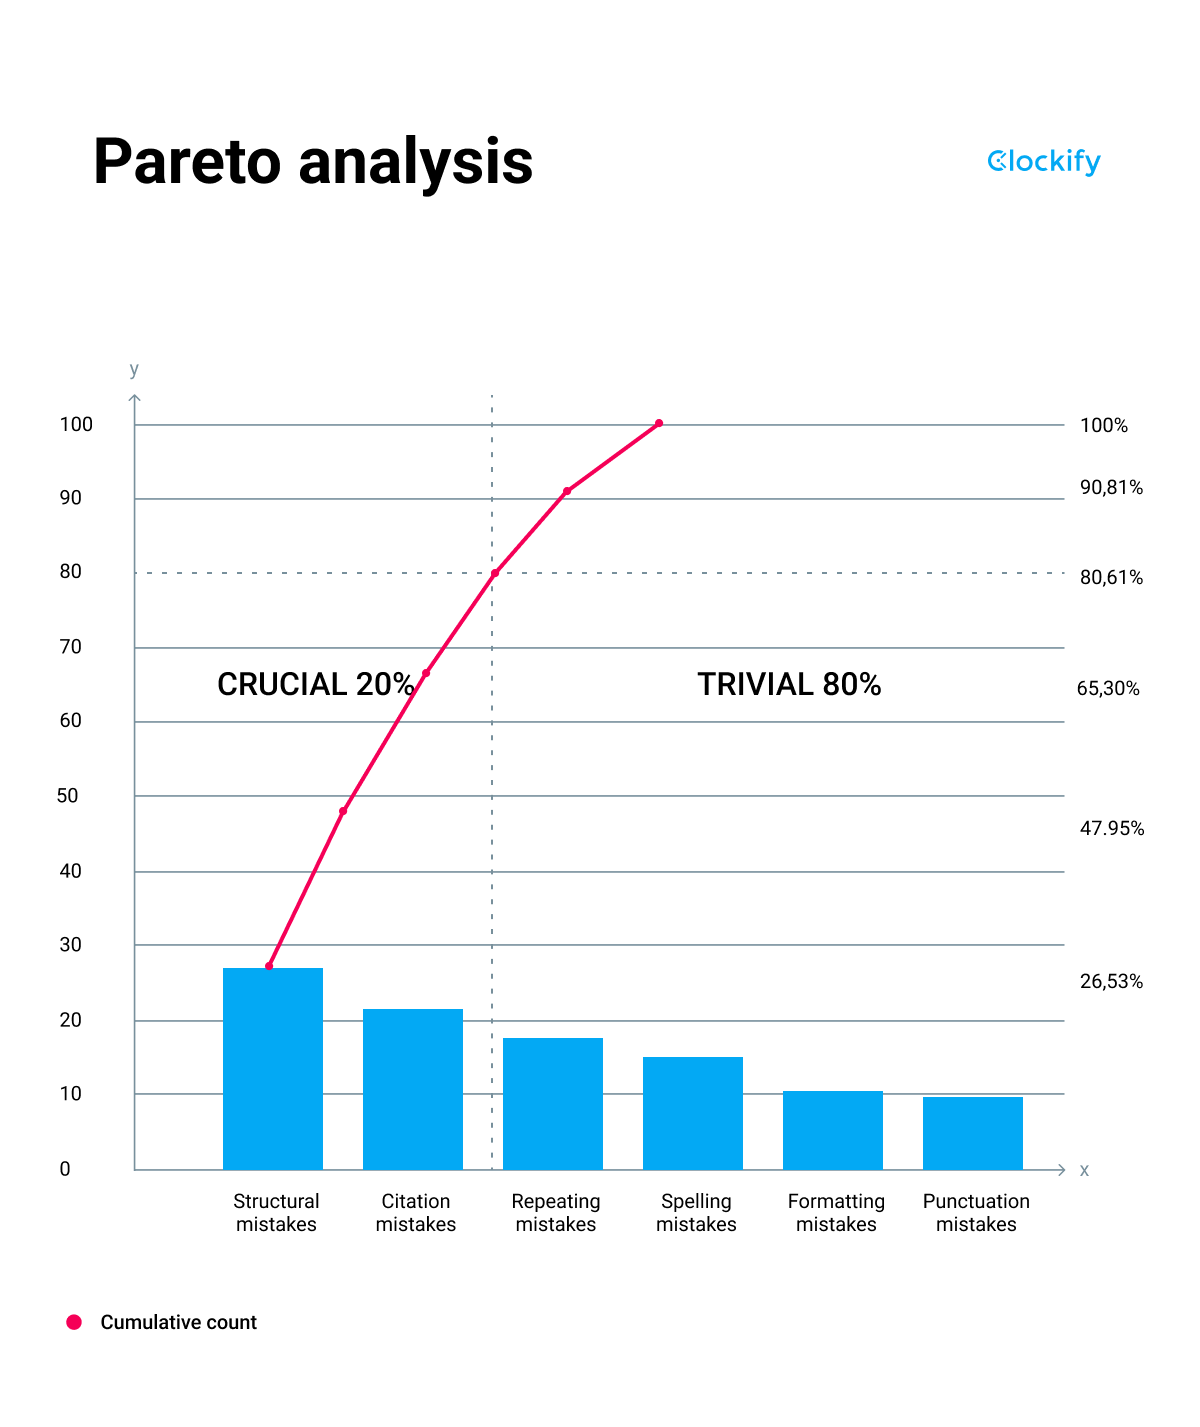
Now we can see that three lines connected at the same spot, making a distinction between the crucial 20% (Structural and Citation mistakes) and the rest, 80% of mistakes that are marked as trivial.
According to the Pareto principle, only 20% of the mistakes make up 80% of the damage in my writing.
Pareto analysis pros and cons
If you want to carry out the Pareto analysis yourself, you must be aware of its advantages and disadvantages.
Among many advantages you may have already discovered up to this point, the Pareto analysis also helps you with:
- Identifying the problems and their root causes that slow you down,
- Sorting out errors and damages with the highest priority,
- Recognizing where you should be focusing more of your efforts (especially during your biological prime time),
- Analyzing data and presenting results in a visual graph for a deeper understanding of your issues, and
- Improving overall performance by detecting time wasters.
On the other hand, Pareto analysis comes with its share of disadvantages. As a matter of fact, this method may:
- Fail to provide solutions to the identified problems and causes,
- Rely solely on past data and cannot be used to predict future challenges,
- Be somewhat time-consuming since it took me a while to carry out the whole analysis and get data, and
- Demonstrate qualitative data rather than quantitative data.
💡 Clockify Pro Tip
Want to know how to predict the future of your projects together with time, budget, and estimates? Take a look at Clockify’s handy feature for project forecasting here:
How to use the Pareto analysis to manage time more effectively
You may be surprised, but the Pareto principle can be used as a very effective tool for time management. Take a look at the following tips that will help you implement the Pareto principle into your everyday life and boost your time management skills.

Tip #1: Use the Pareto analysis to prioritize your issues better
The Pareto analysis is a great prioritization method as it helps you see the problems that have higher priority and that need to be addressed first. As you can see from the example above, problems with the highest scores ended up causing most of the damage, so Pareto may help you or your business resolve top priority issues one by one.
For instance, after careful analysis, you found out that the causes for low product demand have to do with bad marketing. The Pareto analysis showed that poor marketing strategies are some of the main causes for the decrease in your product’s demand. Therefore, it’s time you question your marketing strategies to boost your sales.
Tip #2: Make use of the Pareto analysis to beat distractions
Normally, after you identify the problems that are causing the damage (in this case, time wasting), you will be able to reduce them and increase your focus.
For instance, you’ve implemented the Pareto analysis to see why you can’t seem to finish your work tasks. It turns out that you do your chores during work hours rather than after work, so you end up working long hours.
Remember, the Pareto principle won’t help you find solutions to your problems but rather identify and make sure you are aware of them.
Tip #3: Combine the Pareto analysis with the Pomodoro technique
If your analysis shows that you spend 80% of your work hours taking breaks and sipping coffee with your colleague, you may want to consider trying out the Pomodoro technique.
While you can make use of the Pareto principle to help you identify time wasters, why not implement another time management method that will save you from overworking, such as the Pomodoro itself!
For this purpose (and to spare you from setting your alarm on and off each time), try using the Clockify’s Pomodoro timer.
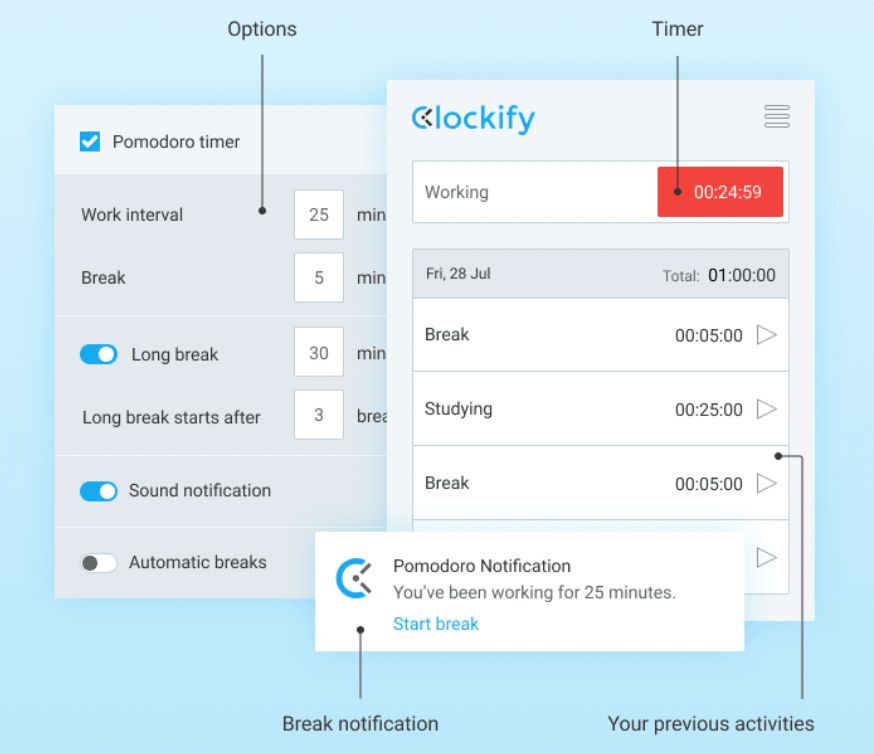
The process is simple:
- Write what you are working on,
- Start a timer for 25 minutes,
- Focus on your work for those 25 minutes,
- When the alarm goes on, stop working, and
- Take a 5-minute break.
Repeat this cycle, as it will help you ensure that you finish your work and take regular breaks along the way, while the Pareto analysis will help you identify your most common time wasters that are draining your productivity. Combined together, the Pareto principle and the Pomodoro technique can be your ally in effective time management.
My overall rating of the Pareto analysis
Although it took me a while to figure it out (and to carry out the analysis itself), I must admit this technique truly works.
Once I looked back, I realized that the crucial 20% of the problems that Pareto pointed out were the ones I struggled with the most in general.
While it cannot solve problems per se, the Pareto analysis can definitely help individuals or businesses identify the causes that affect a particular outcome.
While I was testing out the method, my first thought was: “Obviously I know the reasons behind my writing mistakes!” But somehow, the mistakes would creep up on me every time I sat behind my keyboard. As it turned out, I wasn’t really aware that my formal knowledge wasn’t on such a high level as I thought it was. That’s why the Pareto analysis really had me put on my thinking cap.
Even though the whole process is a bit drawn-out, this method is great, effective, and truly makes you wonder — How did I not realize this sooner?
I certainly recommend it to everyone that struggles with determining the causes that make their workdays harder, and my final rating for this technique is:
FINAL RATING: ⭐⭐⭐⭐
Use Clockify by CAKE.com to improve your time management skills
If you are struggling with time management, implementing the Pareto principle in your everyday life will help you focus on priorities and eliminate time wasters.
By using both Clockify and the Pareto analysis to boost your time management skills, you may achieve peak performance.
How we reviewed this post: Our writers & editors monitor the posts and update them when new information becomes available, to keep them fresh and relevant.