Average Working Hours (Statistical Data 2025)
Did you know that an average worker today needs to work 11 hours per week to produce as much as the one who worked 40 hours per week in 1950?
But does this increased productivity mean that we must have drastically reduced our working hours since the 20th century?
Let’s look at the numbers and see how working hours statistics have changed throughout history and discover in which countries people work the most hours today.
*Note: some decimal values are rounded to the nearest whole number.

Working hours through history
To start with, employees now work 20 to 30 hours less every week compared to the 19th century.
Furthermore, average work hours in developed countries fell from 3,000 hours per year in 1870 to between 1,500 and 2,000 hours per year by 1990.
But this long-term decline in average annual work hours has slowed down in almost all countries around the world — and even reversed.
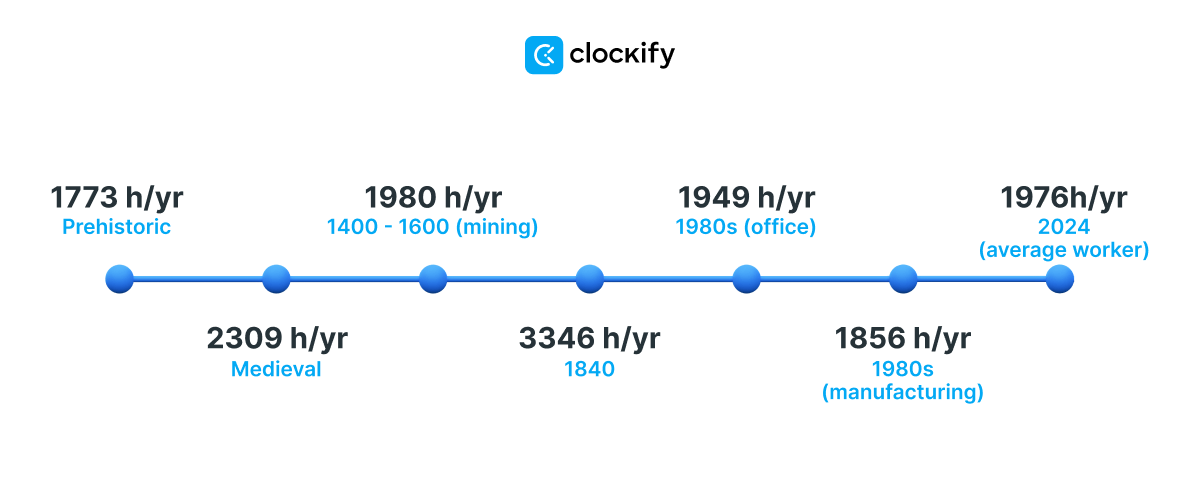
As a matter of fact, the work time in primitive hunter-gatherer societies was much lower than in modern agricultural societies. Compared to prehistoric people, who worked 1,773 hours per year on average, modern farmers spent 1,980 hours per year working.
| Period | Work hours |
|---|---|
| Prehistoric (hunter-gatherer societies) | 1,773 hours/year |
| 13th century (adult male peasant, UK) | 1,620 hours/year |
| 14th century (casual laborer, UK) | 1,440 hours/year |
| Middle ages (English worker) | 2,309 hours/year |
| 1400-1600 (farmer-miner, adult male, UK) | 1,980 hours/year |
| 1840 (average worker, UK) | 3,105-3,588 hours/year |
| 1850 (average worker, US) | 3,150-3,650 hours/year |
| 1987 (average worker, US) | 1,949 hours/year |
| 1988 (manufacturing workers, UK) | 1,856 hours/year |
| 2024 (average worker, US) | 1,976 hours/year |
Even though the Industrial Revolution brought about long working hours, immediately after the size of the labor force expanded in the 1980s, average working hours were reduced.
As time went on and the industries progressed, the working hours continued to drop, according to Our World in Data findings. That drop wasn’t consistent, though.
By looking at the graph below, we can spot the changes in annual working hours that employees spent working in the last couple of decades.
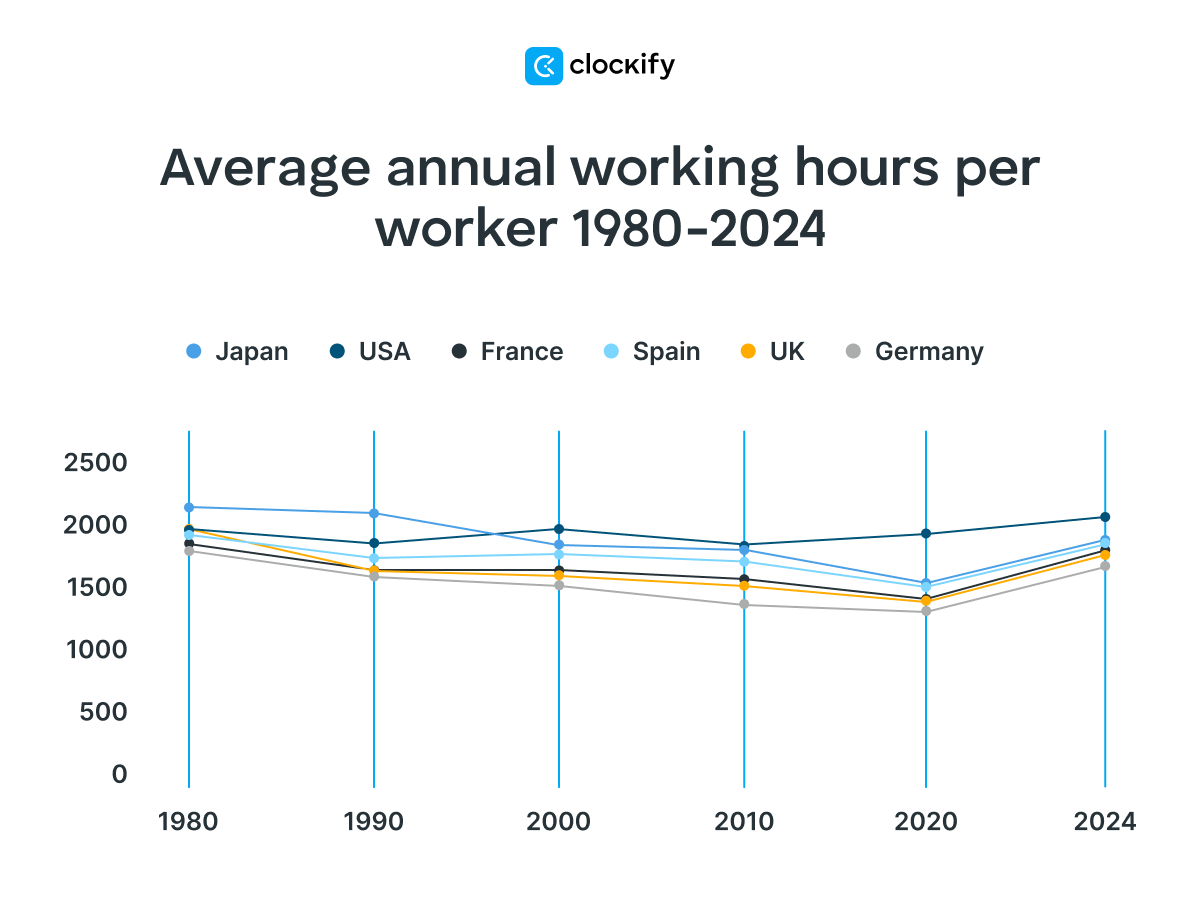
When we take into account the International Labor Organization’s (ILO) working hours statistics from 2024, the average annual working hours increased for some countries.
For example, French workers spent 1,779 hours per year working in 1980 (Our World in Data). That number significantly reduced to 1,400 hours per year in 2020 according to OECD Data Explorer — only to shoot up to 1,867 hours per year in 2024 (ILO), even more than in 1980.
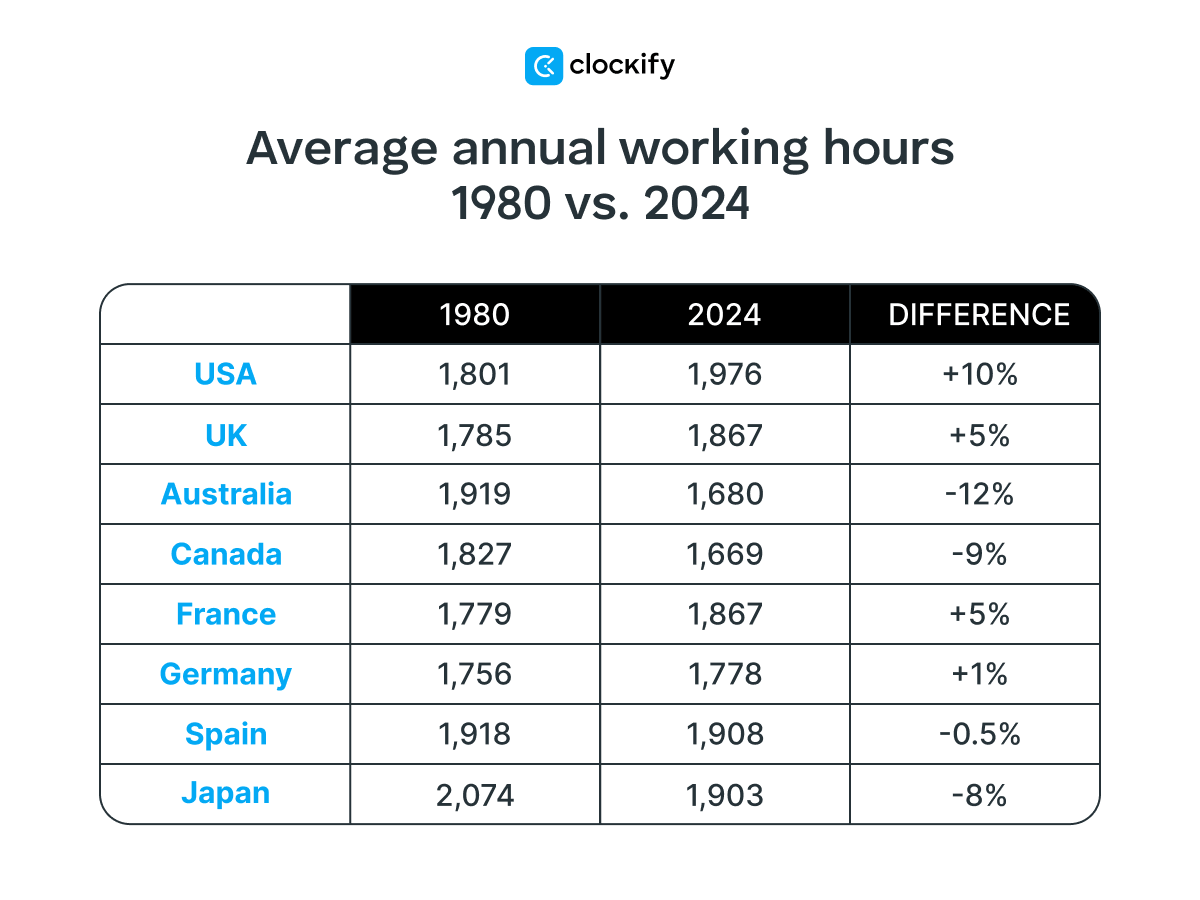
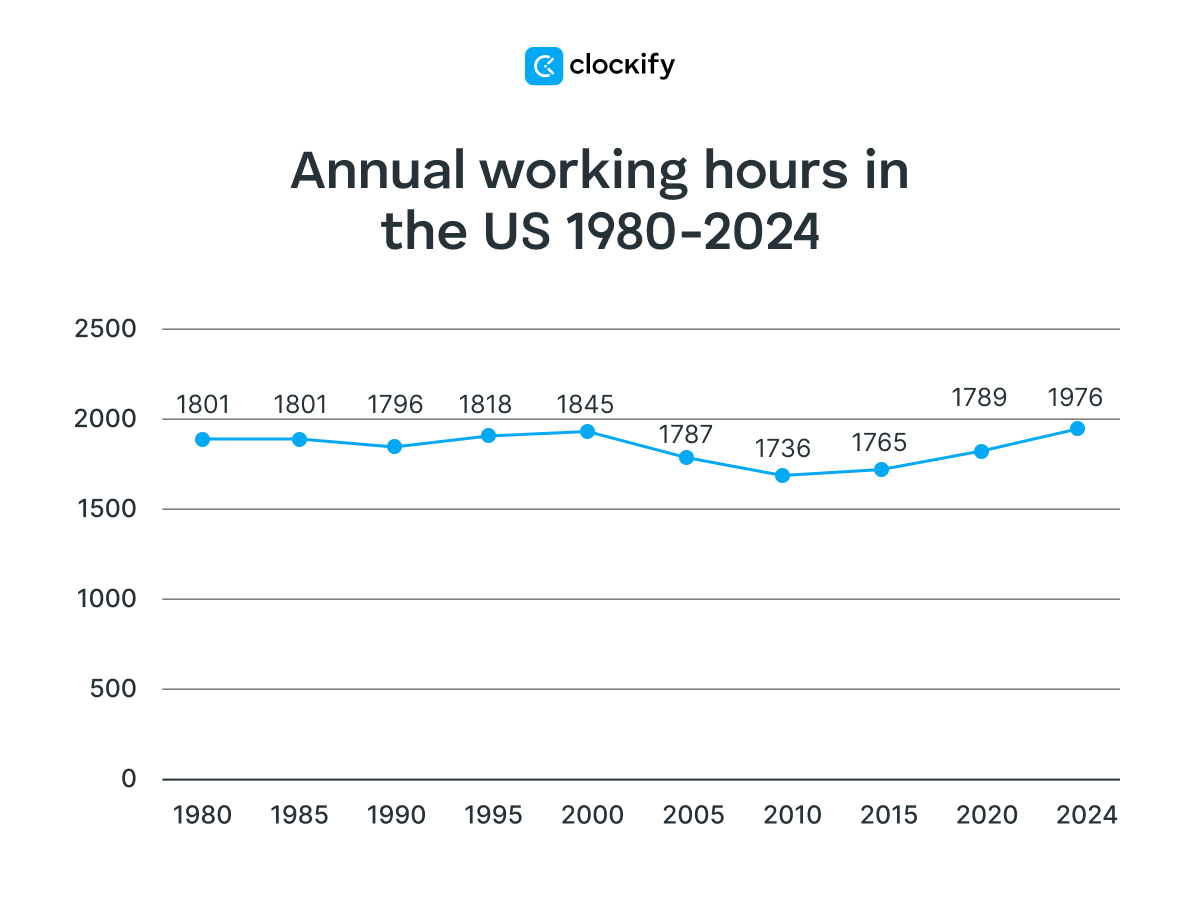
In the US, as well, at 1,976 hours per year in 2024, there was an increase compared to the 1980s.
Working hours statistics by country
Even though employees today spend drastically less time working than they did during the Industrial Revolution — their average annual working hours significantly differ, depending on the country they live in.
Annual working hours per employee (worldwide)
The table below provides more information on the average annual working hours per employee in countries around the world in 2024, according to the International Labor Organization (ILO).
| Country | Average hours per year |
|---|---|
|
Afghanistan |
2,059h |
|
Albania |
2,168h |
|
Algeria |
2,272h |
|
Angola |
2,153h |
|
Argentina |
1,924h |
|
Armenia |
2,085h |
|
Aruba |
2,045h |
|
Australia |
1,680h |
|
Austria |
1,732h |
|
Azerbaijan |
1,789h |
|
Bangladesh |
2,439h |
|
Belarus |
2,033h |
|
Belgium |
1,820h |
|
Belize |
2,028h |
|
Benin |
2,101h |
|
Bermuda |
2,174h |
|
Bhutan |
2,829h |
|
Bolivia |
1,976h |
|
Bosnia & Herzegovina |
2,153h |
|
Botswana |
2,278h |
|
Brazil |
2,028h |
|
Brunei Darussalam |
2,392h |
|
Bulgaria |
2,038h |
|
Burkina Faso |
2,408h |
|
Burundi |
2,096h |
|
Cabo Verde |
2,356h |
|
Cambodia |
2,101h |
|
Canada |
1,669h |
|
Cayman Islands |
2,184h |
|
Chile |
2,101h |
|
China |
2,397h |
|
Colombia |
2,298h |
|
Comoros |
1,966h |
|
Congo |
2,527h |
|
Congo, Democratic Republic of the |
1,888h |
|
Cook Islands |
1,924h |
|
Costa Rica |
2,210h |
|
Côte d'Ivoire |
2,215h |
|
Croatia |
1,971h |
|
Cuba |
2,132h |
|
Curaçao |
1,903h |
|
Cyprus |
1,955h |
|
Czechia |
1,960h |
|
Denmark |
1,763h |
|
Dominican Republic |
2,122h |
|
Ecuador |
1,997h |
|
Egypt |
2,236h |
|
El Salvador |
2,246h |
|
Estonia |
1,908h |
|
Eswatini |
2,220h |
|
Ethiopia |
1,659h |
|
Falkland Islands (Malvinas) |
2,324h |
|
Finland |
1,789h |
|
France |
1,867h |
|
Gambia |
2,163h |
|
Georgia |
2,106h |
|
Germany |
1,778h |
|
Ghana |
2,002h |
|
Greece |
2,064h |
|
Grenada |
2,090h |
|
Guyana |
2,324h |
|
Haiti |
2,184h |
|
Honduras |
2,267h |
|
Hong Kong, China |
2,236h |
|
Hungary |
2,002h |
|
Iceland |
1,888h |
|
India |
2,428h |
|
Indonesia |
2,080h |
|
Iran |
2,304h |
|
Iraq |
1,648h |
|
Ireland |
1,851h |
|
Isle of Man |
1,820h |
|
Israel |
2,002h |
|
Italy |
1,888h |
|
Jamaica |
2,220h |
|
Japan |
1,903h |
|
Jersey |
2,080h |
|
Jordan |
2,444h |
|
Kazakhstan |
1,976h |
|
Kenya |
2,371h |
|
Kiribati |
1,420h |
|
Korea |
2,007h |
|
Kosovo |
2,246h |
|
Kyrgyzstan |
1,976h |
|
Lao People's Democratic Republic |
2,158h |
|
Latvia |
2,023h |
|
Lebanon |
2,475h |
|
Lesotho |
2,621h |
|
Liberia |
2,480h |
|
Lithuania |
2,007h |
|
Luxembourg |
1,851h |
|
Macau, China |
2,392h |
|
Madagascar |
1,794h |
|
Malaysia |
2,324h |
|
Maldives |
2,418h |
|
Mali |
2,179h |
|
Malta |
1,914h |
|
Marshall Islands |
1,971h |
|
Mauritania |
2,475h |
|
Mauritius |
2,085h |
|
Mexico |
2,272h |
|
Micronesia |
1,581h |
|
Moldova |
2,064h |
|
Mongolia |
2,460h |
|
Montenegro |
2,252h |
|
Montserrat |
2,028h |
|
Morocco |
2,335h |
|
Mozambique |
1,893h |
|
Myanmar |
2,324h |
|
Namibia |
2,335h |
|
Nauru |
1,945h |
|
Nepal |
2,132h |
|
Netherlands |
1,643h |
|
New Caledonia |
1,934h |
|
New Zealand |
1,716h |
|
Nicaragua |
1,898h |
|
Niger |
2,064h |
|
Niue |
2,007h |
|
North Macedonia |
2,064h |
|
Norway |
1,752h |
|
Occupied Palestinian Territory |
2,158h |
|
Pakistan |
2,439h |
|
Palau |
2,075h |
|
Panama |
1,882h |
|
Peru |
2,241h |
|
Philippines |
2,111h |
|
Poland |
2,070h |
|
Portugal |
1,986h |
|
Qatar |
2,496h |
|
Réunion |
1,716h |
|
Romania |
2,064h |
|
Russian Federation |
2,038h |
|
Rwanda |
1,581h |
|
Saint Lucia |
2,075h |
|
Samoa |
2,314h |
|
Senegal |
2,366h |
|
Serbia |
2,184h |
|
Seychelles |
2,116h |
|
Sierra Leone |
2,220h |
|
Singapore |
2,215h |
|
Slovakia |
1,960h |
|
Slovenia |
2,012h |
|
Solomon Islands |
1,799h |
|
Somalia |
1,633h |
|
South Africa |
2,215h |
|
Spain |
1,908h |
|
Sri Lanka |
2,205h |
|
Sweden |
1,836h |
|
Switzerland |
1,856h |
|
Tajikistan |
2,158h |
|
Tanzania |
2,064h |
|
Thailand |
2,200h |
|
Timor-Leste |
1,815h |
|
Tonga |
1,992h |
|
Tunisia |
2,304h |
|
Turkey |
2,283h |
|
Uganda |
2,314h |
|
Ukraine |
2,028h |
|
United Arab Emirates |
2,647h |
|
UK |
1,867h |
|
USA |
1,976h |
|
Uruguay |
1,940h |
|
Vanuatu |
1,284h |
|
Venezuela |
2,012h |
|
Viet Nam |
2,163h |
|
Wallis and Futuna Islands |
1,654h |
|
Yemen |
2,158h |
|
Zambia |
2,262h |
|
Zimbabwe |
2,148h |
*The average annual working hours in the table are the average weekly hours provided by the International Labour Organization multiplied by 52. Decimal values are rounded to the nearest whole number.
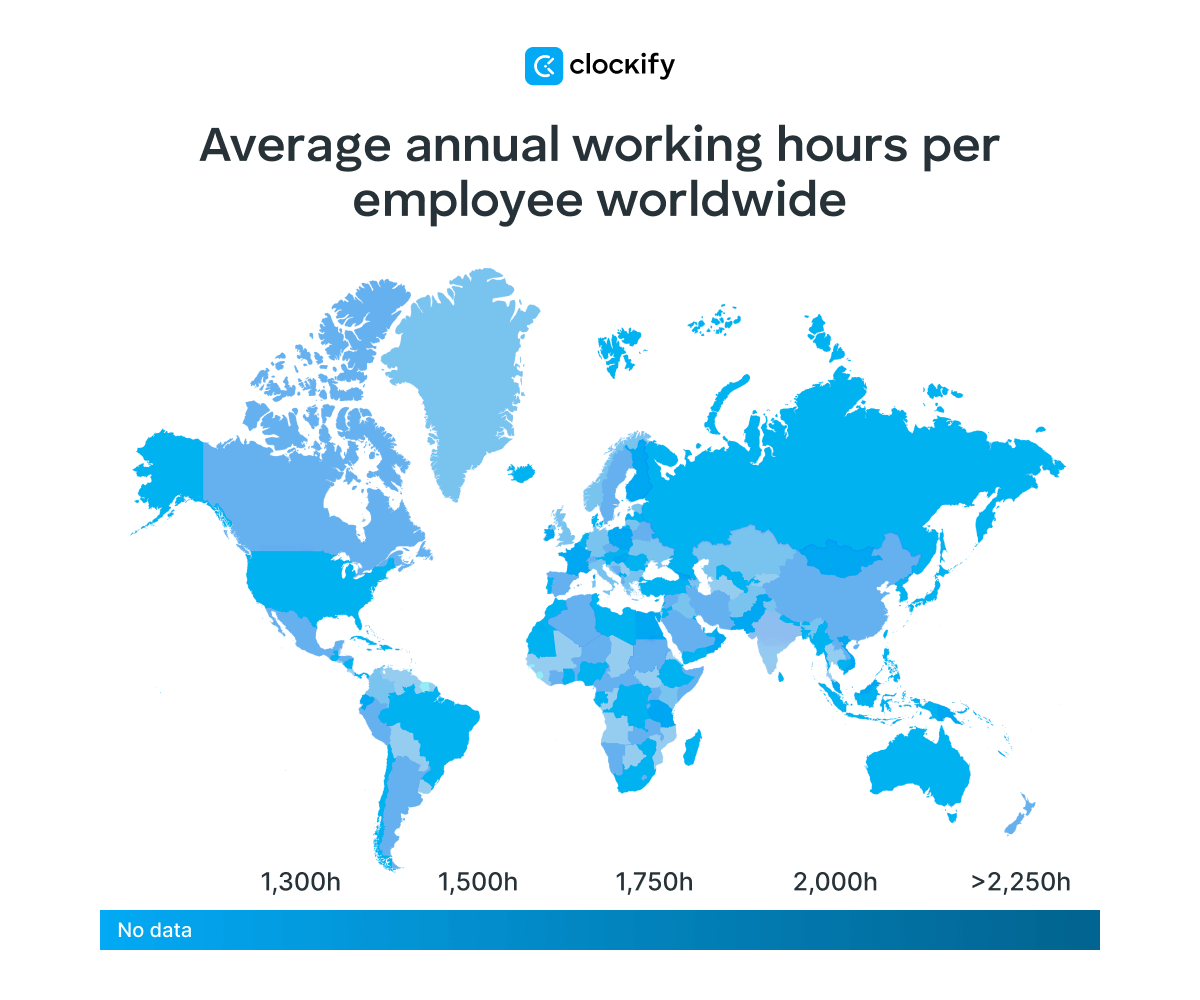
So, for example, while employees in Turkey spend circa 2,283 hours a year at work, workers from the Netherlands work about 1,643 hours per year.
Workers in Bhutan spend the most time working in the world at circa 2,829 hours a year. On the other hand, employees from Vanuatu seem to have the world’s lowest annual work hours of about 1,284 hours per year.

How many hours is a typical workweek?
The average workweek varies by country. However, it can range from less than 40 hours to about 50 hours per week (and sometimes even more).
The following tables show ILO’s 2024 data on countries with the longest and shortest workweek in the world.
10 countries with the longest workweek in the world (in hours worked)
Below is the list of the top 10 countries with the highest average of weekly work hours, with a percentage of employees who work more than 49 hours a week.
|
Country |
Average hours per week |
Share of employees working 49+ hours per week |
|
Bhutan |
54.4 |
61% |
|
United Arab Emirates |
50.9 |
39% |
|
Lesotho |
50.4 |
36% |
|
Congo |
48.6 |
45% |
|
Qatar |
48 |
29% |
|
Liberia |
47.7 |
27% |
|
Mauritania |
47.6 |
46% |
|
Lebanon |
47.6 |
38% |
|
Mongolia |
47.3 |
33% |
|
Jordan |
47 |
34% |
10 countries with the shortest workweek in the world (in hours worked)
Below is the list of the top 10 countries with the lowest average of weekly work hours, with a percentage of employees who work more than 49 hours a week.
|
Country |
Average hours per week |
Share of employees working 49+ hours per week |
|
Vanuatu |
24.7 |
4% |
|
Kiribati |
27.3 |
10% |
|
Micronesia |
30.4 |
2% |
|
Rwanda |
30.4 |
12% |
|
Somalia |
31.4 |
10% |
|
Netherlands |
31.6 |
6% |
|
Iraq |
31.7 |
5% |
|
Wallis and Futuna Islands |
31.8 |
6% |
|
Ethiopia |
31.9 |
15% |
|
Canada |
32.1 |
9% |
Now, let’s take a closer look at how working hours differ across the world by going over:
- Working hours in OECD countries,
- Working hours in the EU,
- Working hours in the UK,
- Working hours in Germany, and
- Working hours in the US.
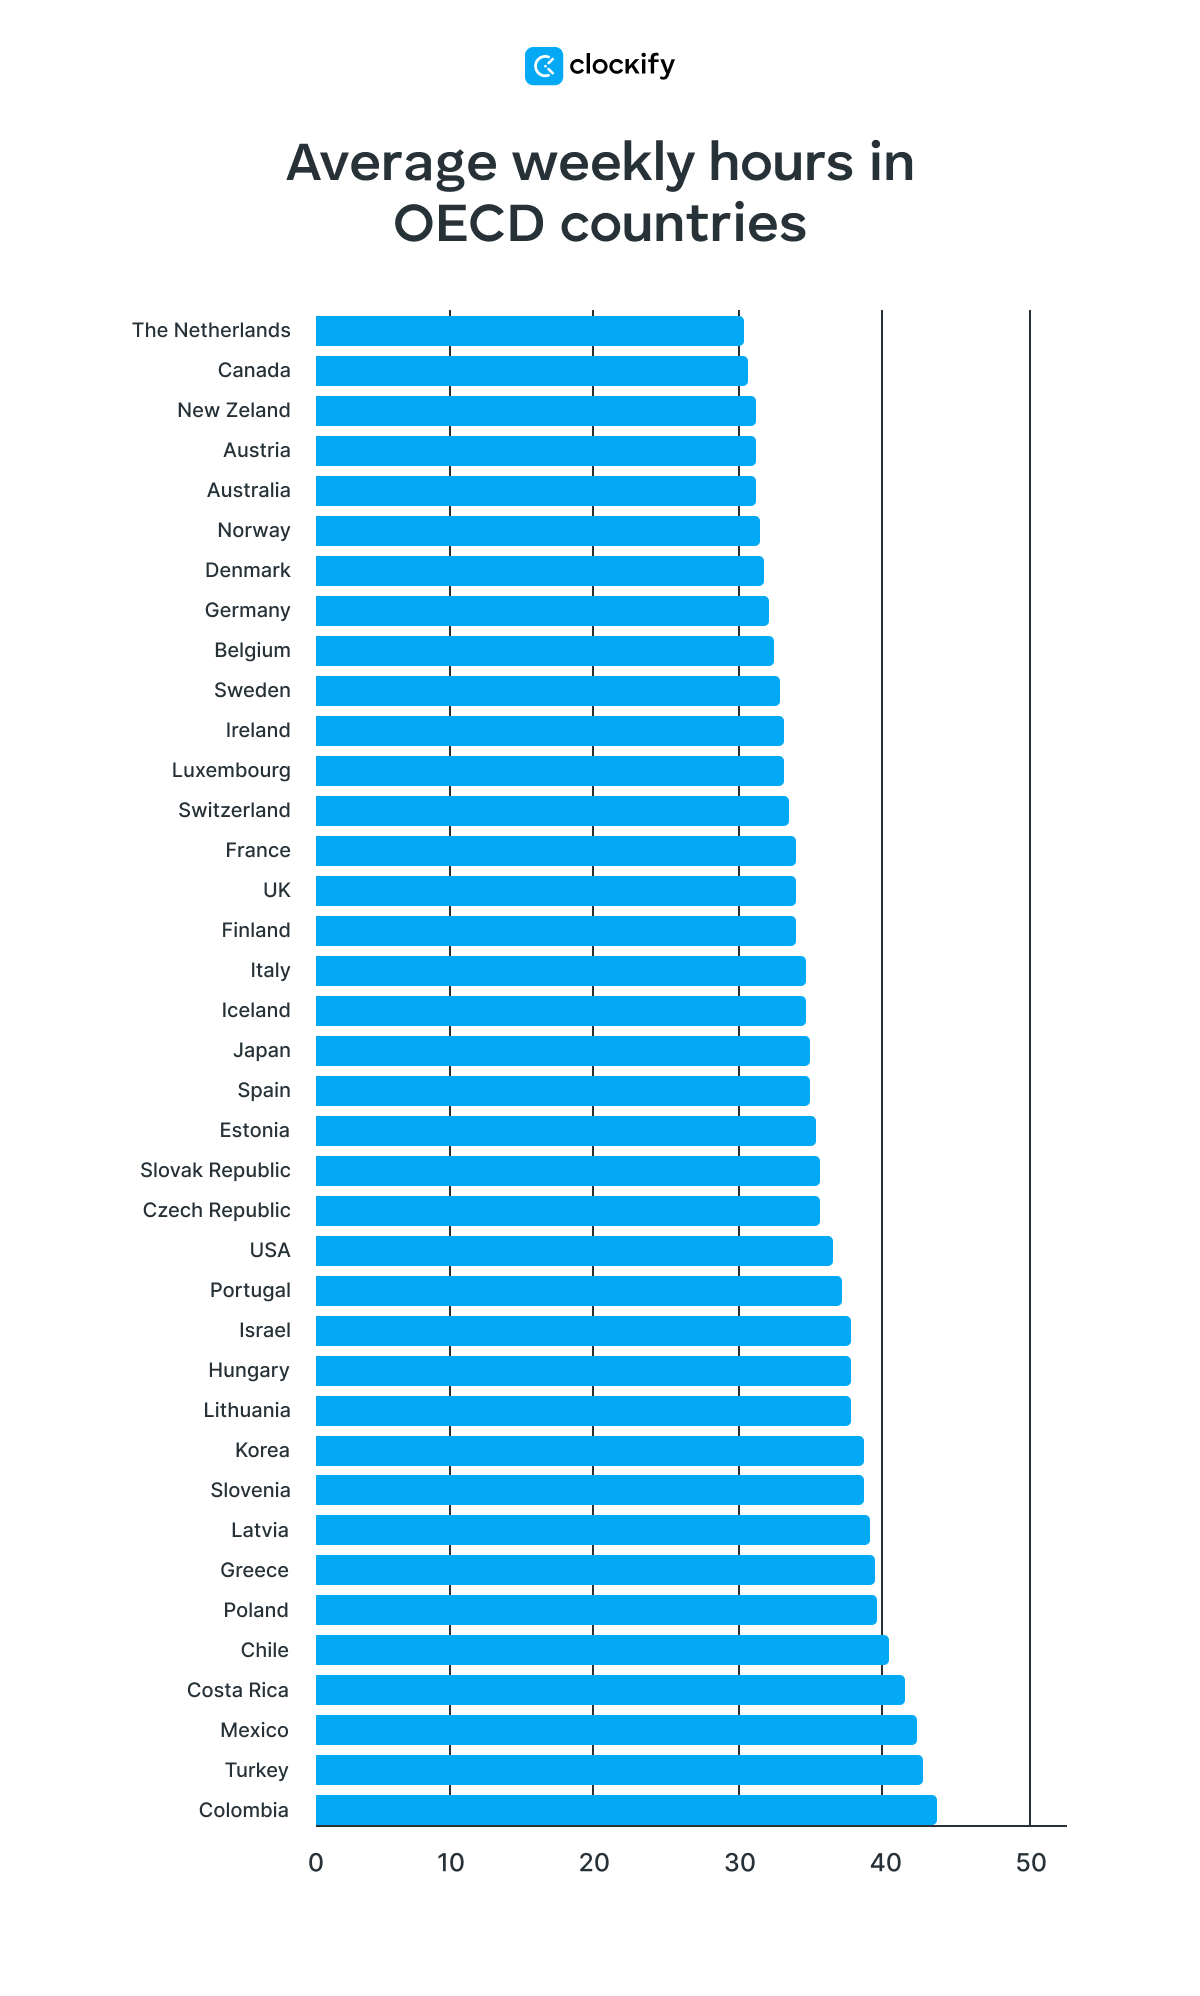
Working hours in OECD countries
Currently, there are 38 OECD countries, namely Australia, Austria, Belgium, Canada, Chile, Colombia, Costa Rica, Czech Republic, Denmark, Estonia, Finland, France, Germany, Greece, Hungary, Iceland, Ireland, Israel, Italy, Japan, Korea, Latvia, Lithuania, Luxembourg, Mexico, Netherlands, The, New Zealand, Norway, Poland, Portugal, Slovak Republic, Slovenia, Spain, Sweden, Switzerland, Turkey, UK, and USA.
On average, a full-time employee in an OECD country works 37.1 hours per week.
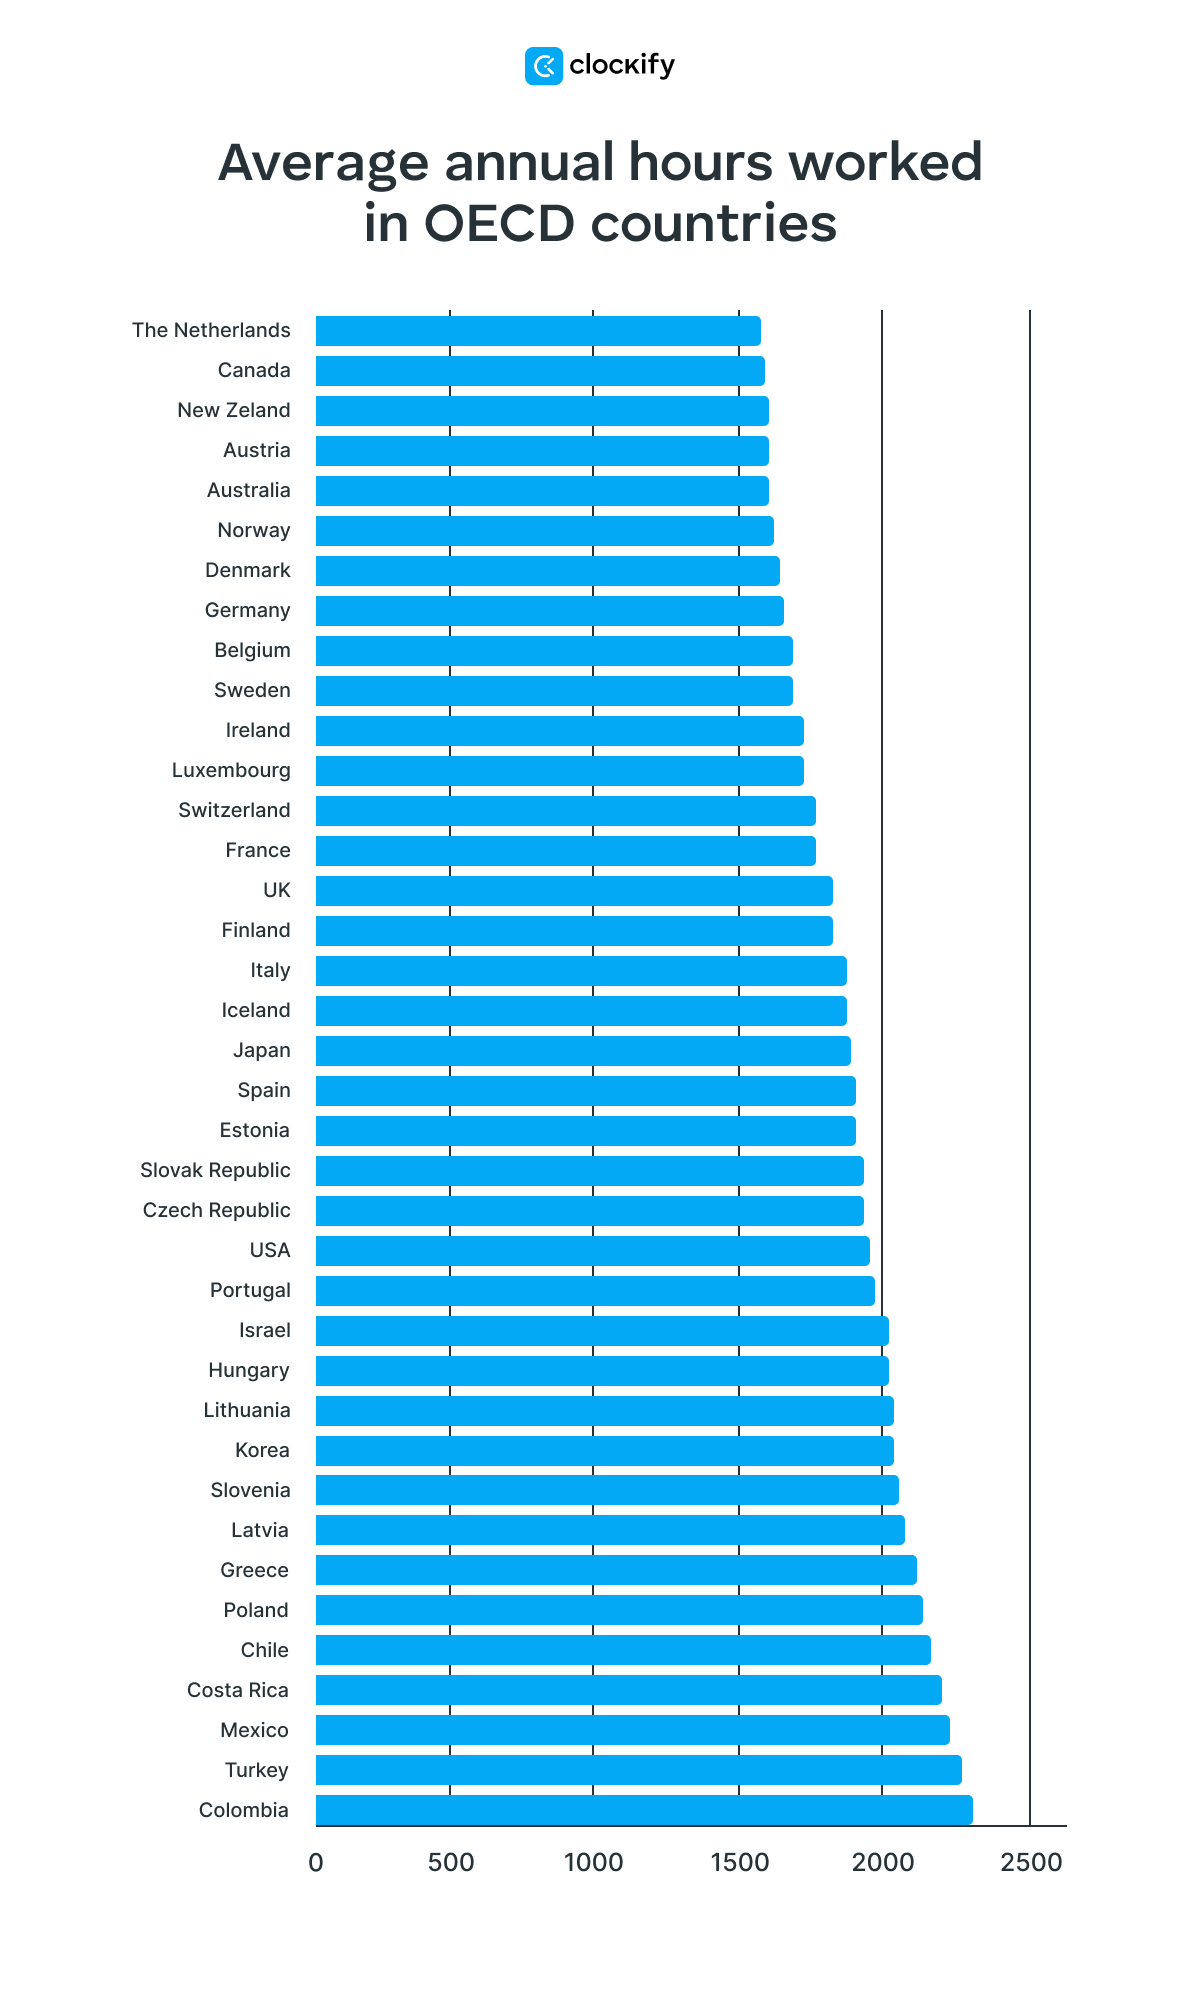
This translates to an average of 1,929 working hours per year, out of which workers in the Netherlands spent the least amount of time at work (1,643 hours per year). On the other hand, an average employee in Colombia had 2,298 hours worked in 2024 (ILO).
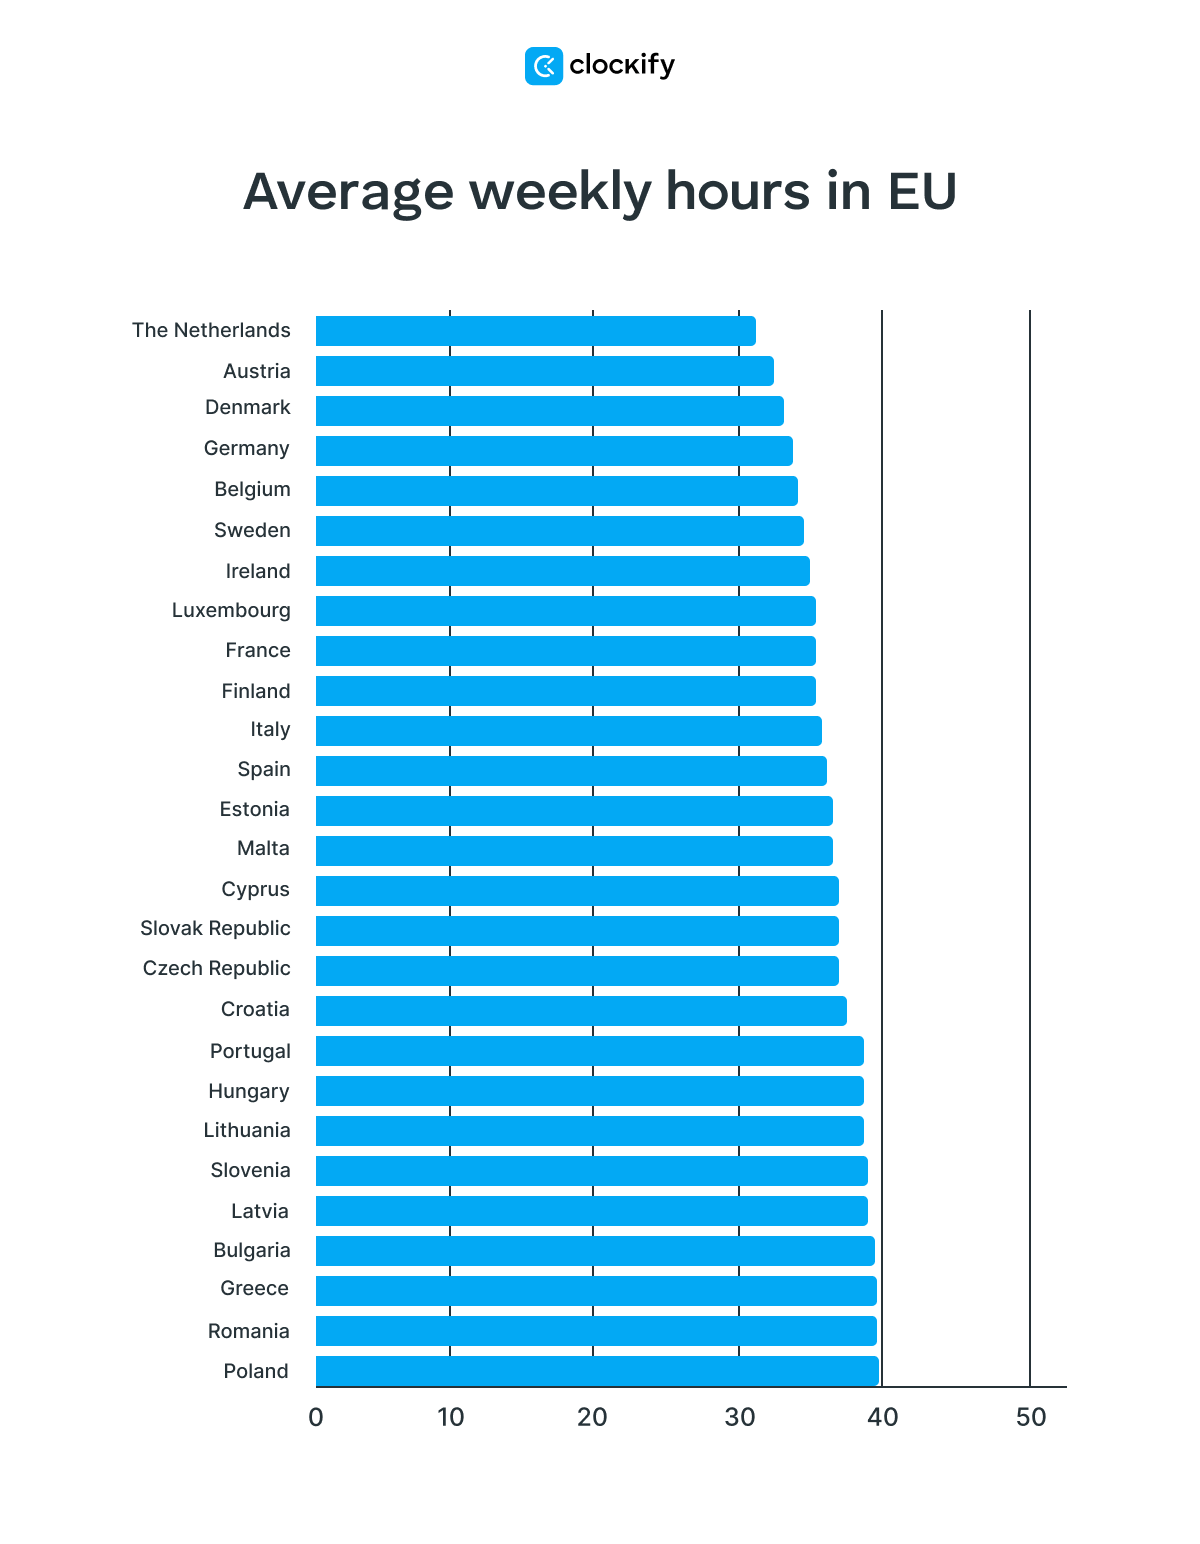
Working hours in the EU
Currently, there are 27 countries in the EU (European Union), namely Austria, Belgium, Bulgaria, Croatia, Cyprus, Czech Republic, Denmark, Estonia, Finland, France, Germany, Greece, Hungary, Ireland, Italy, Latvia, Lithuania, Luxembourg, Malta, Netherlands, The, Poland, Portugal, Romania, Slovak Republic, Slovenia, Spain, and Sweden.
An average full-time employee in the European Union works 36.8 hours per week (main job).
In 2024, the longest working hours were reported in Poland — 39.8 hours per week, while employees spent the least time working in the Netherlands — 31.6 hours on average weekly (ILO).
By EU labor law, working hours are limited to 48 hours per week, including overtime (if permitted by national law, you may have an agreement with a staff member to work beyond the 48-hour limit).
Working hours statistics by industry in the EU
According to the most recent Eurostat data, employees working in the agriculture, forestry, and fishing industries in the EU worked the longest hours — 41.5 weekly hours on average in 2023.
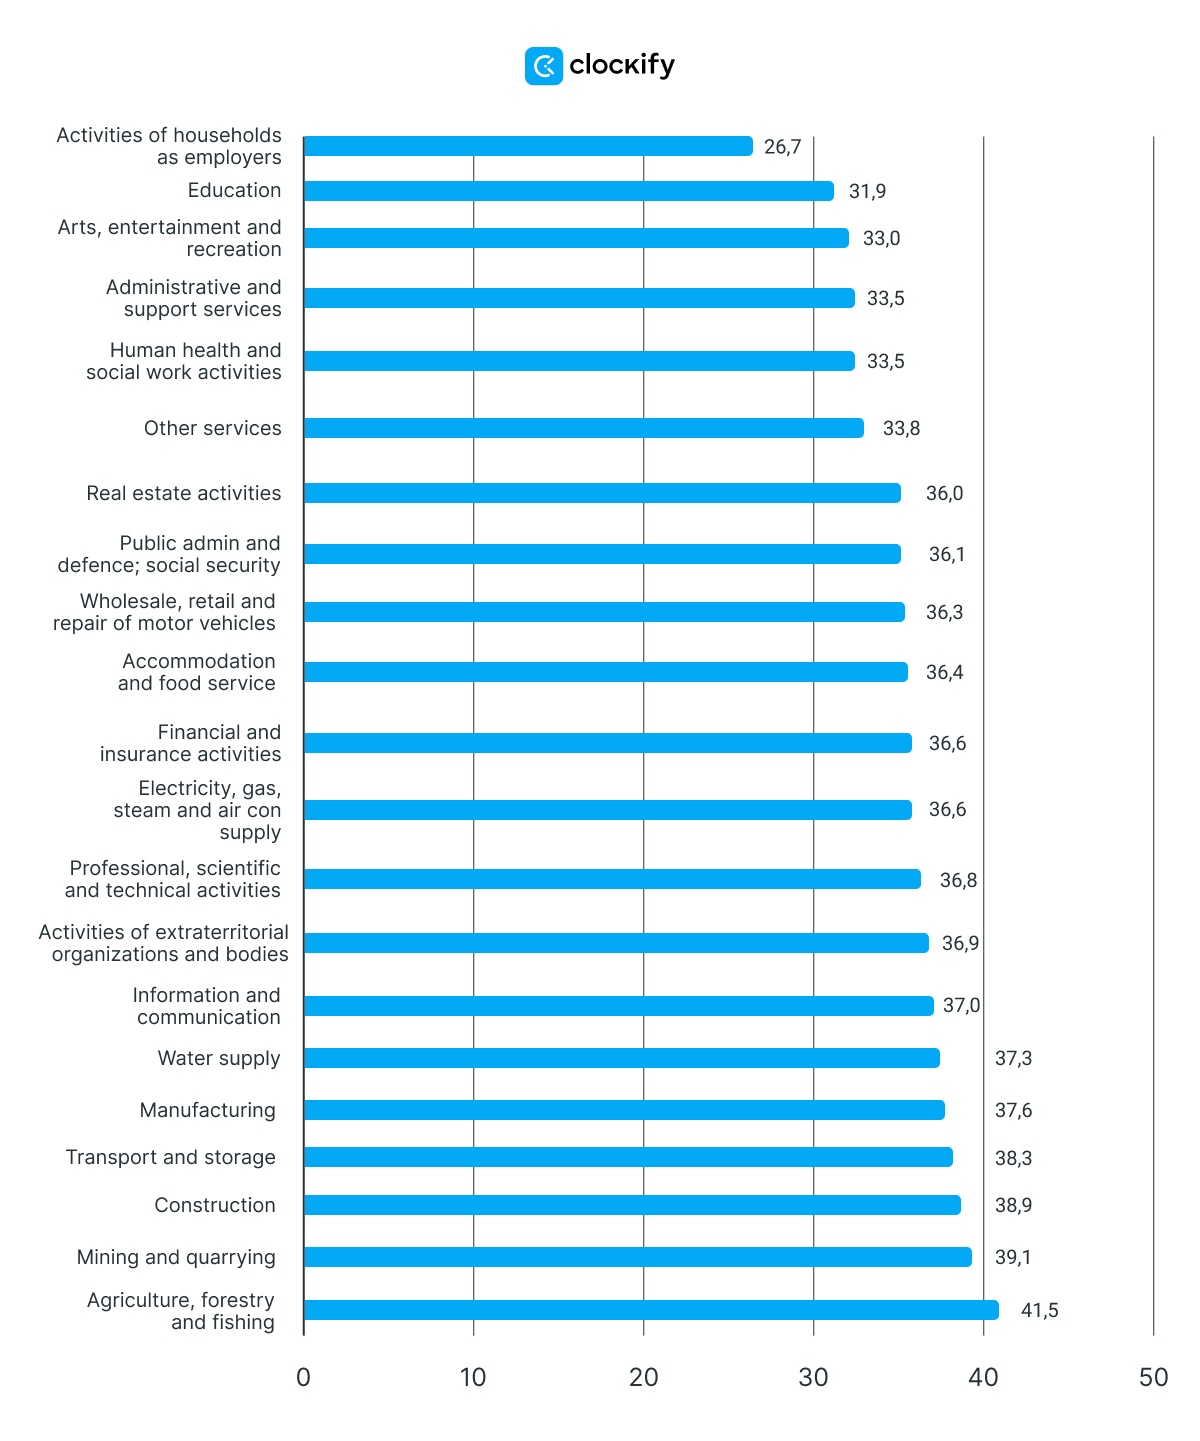
On the other hand, the activities of households as employers (of domestic personnel like maids, cooks, waiters, servants, gardeners, chauffeurs, etc.) show the lowest number of work hours — 26.7 per week, followed by education workers in the EU (31.9 weekly hours) in 2023.
🎓 Mandatory Overtime: What You Need to Know
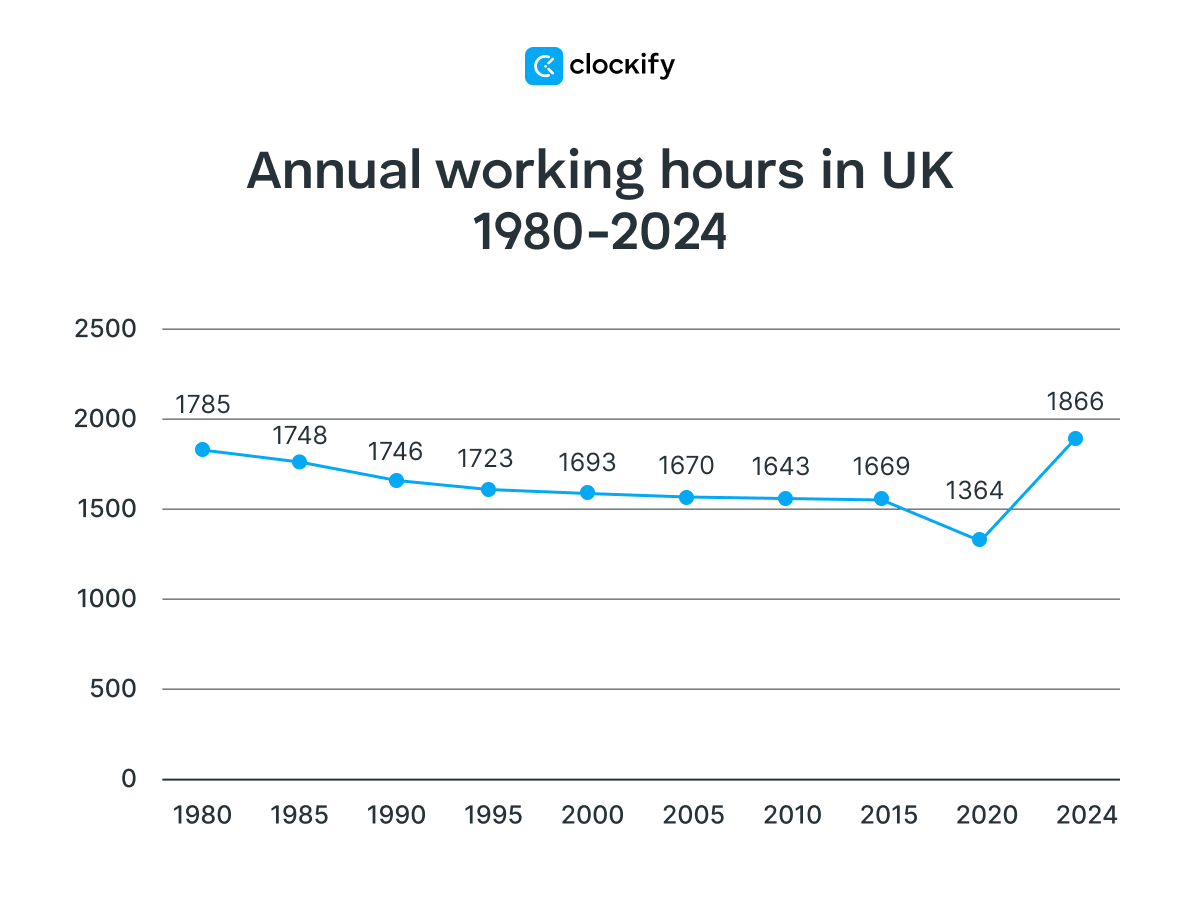
Working hours in the UK
On average, a full-time employee in the United Kingdom works 1,867 hours per year or 35.9 weekly hours.
Working hours statistics by industry in the UK
According to the most recent Office for National Statistics data, employees working in the agriculture, forestry, and fishing industries in the UK worked the longest hours — 42.2 weekly hours on average in the last quarter of 2024.
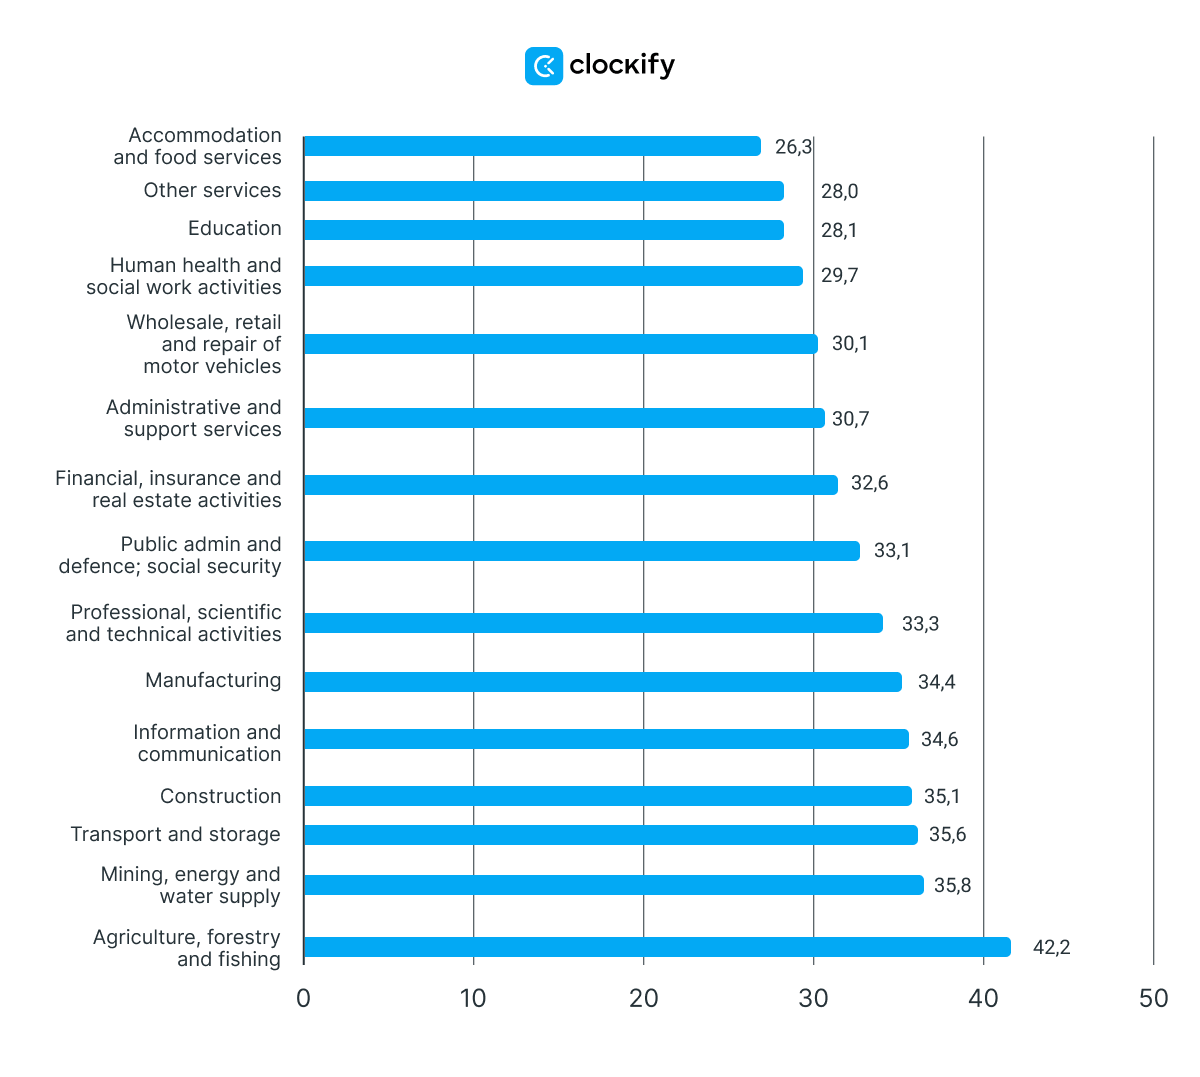
On the other hand, accommodation and food services workers in the UK have the least working hours — 26.3 weekly hours in the last quarter of 2024.
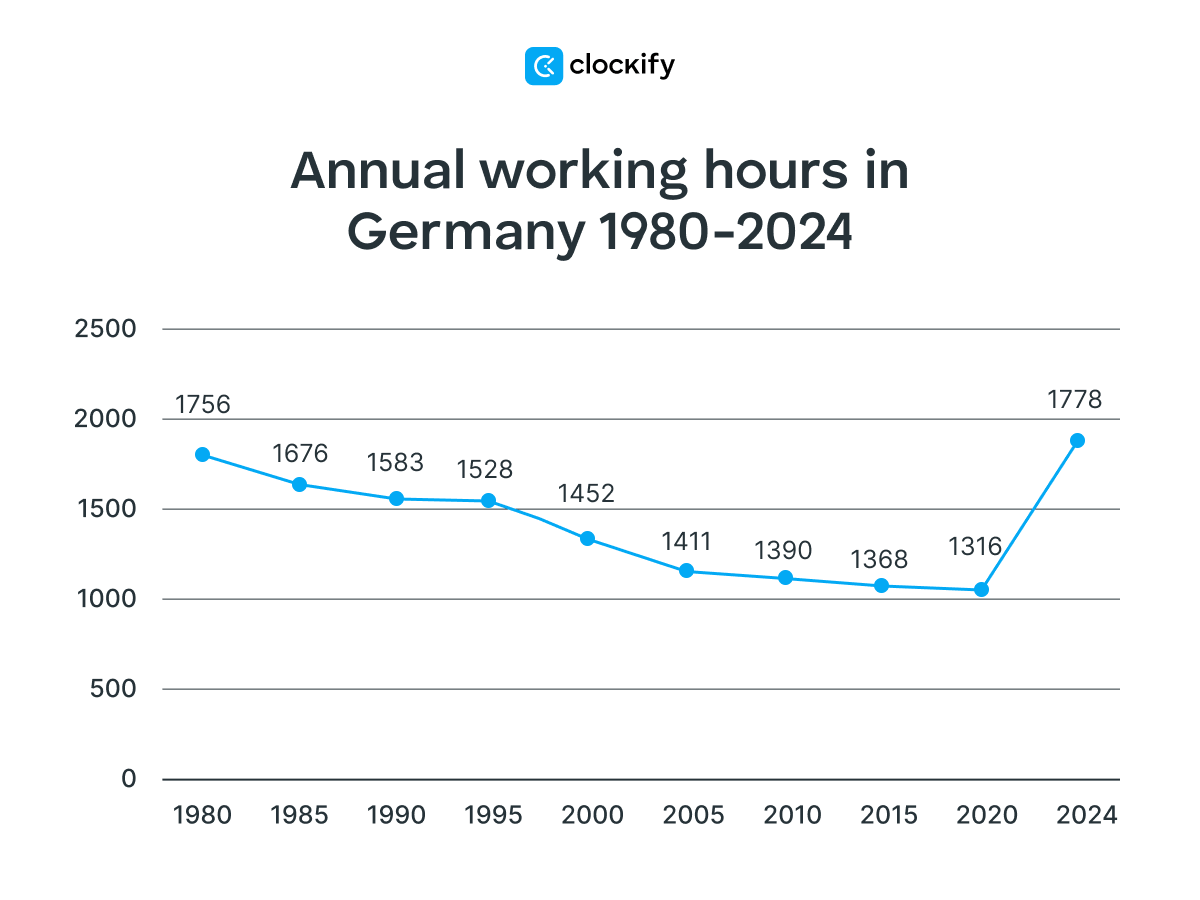
Working hours in Germany
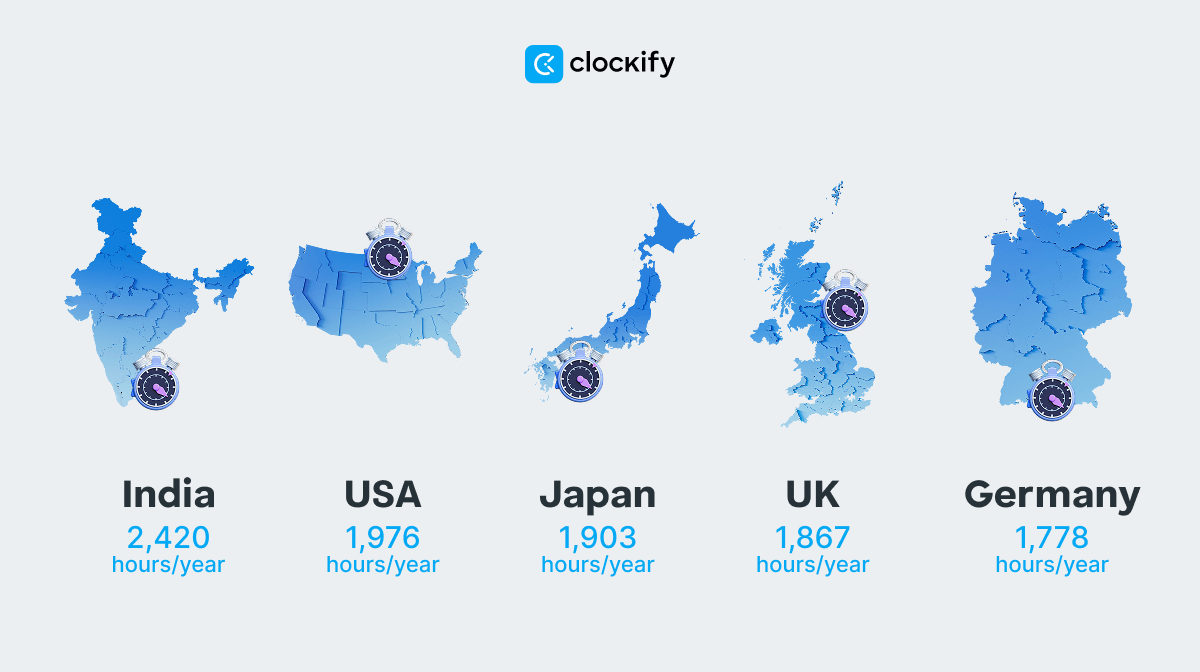
When it comes to Germany, a full-time employee works 1,778 hours per year, or 34.2 hours on average weekly.
Working hours statistics by industry in Germany
According to the most recent Eurostat data, employees working in the agriculture, forestry, and fishing industries in Germany worked the longest hours — 39.9 weekly hours on average in 2023.
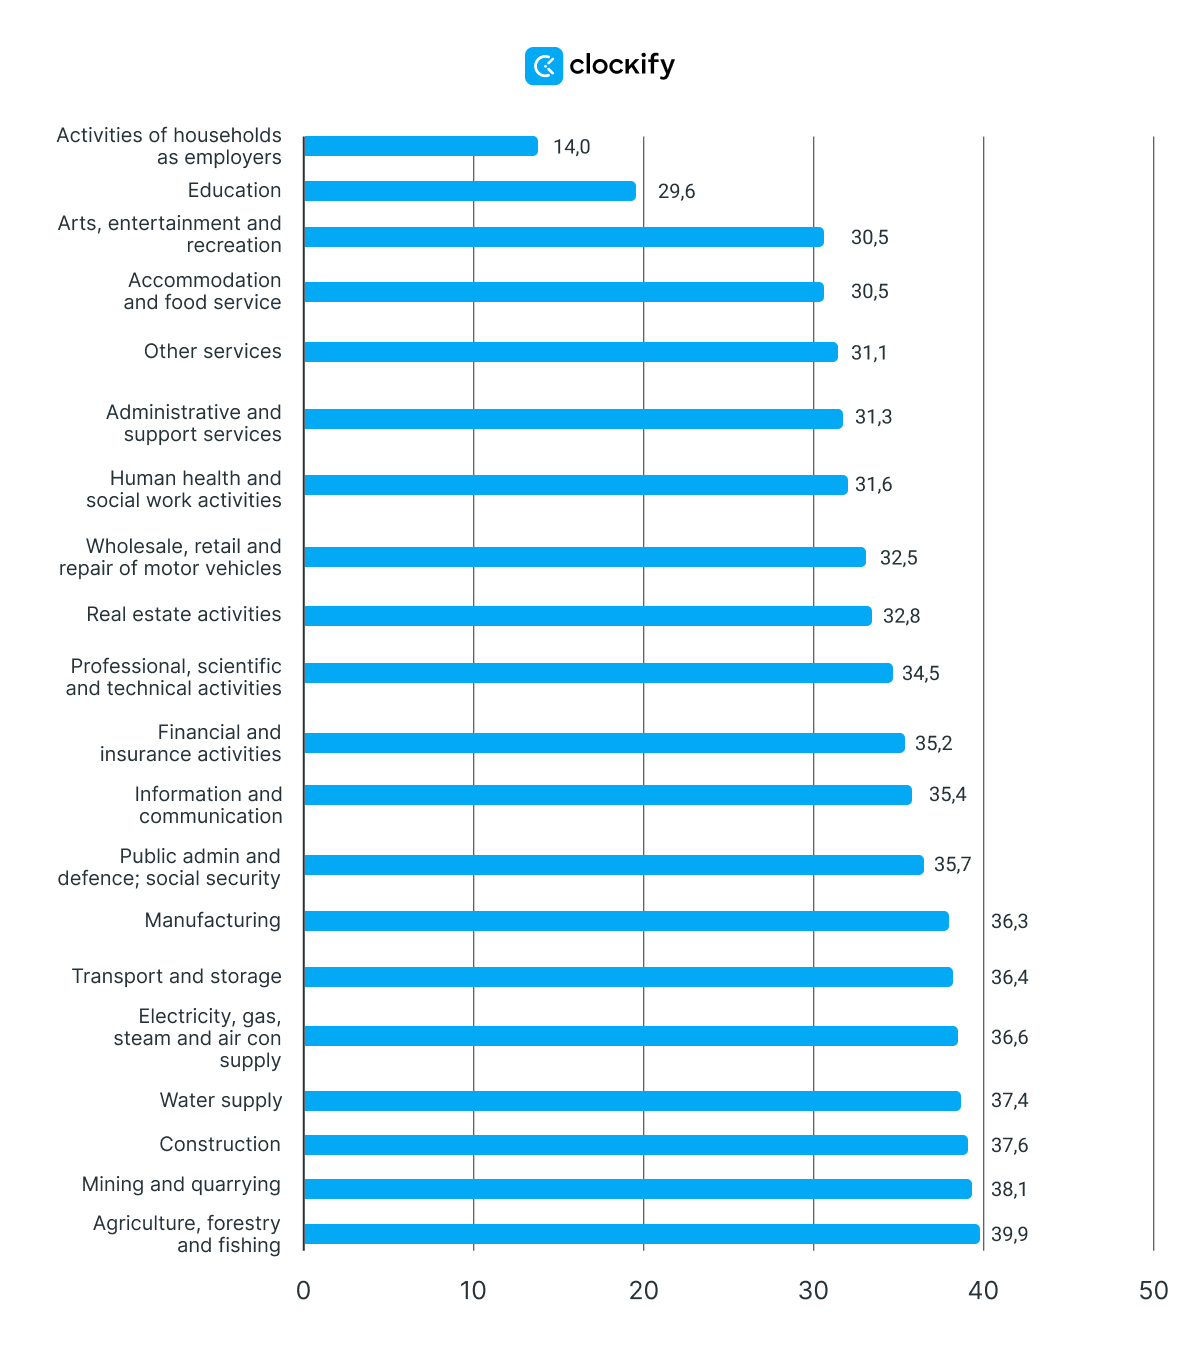
On the other hand, the activities of households as employers show the lowest number of work hours — 14 per week, followed by education workers in Germany (29.6 weekly hours) in 2023.
Working hours in Japan
In Japan, a full-time worker spends 36.6 hours per week working, or about 1,903 hours a year on average.
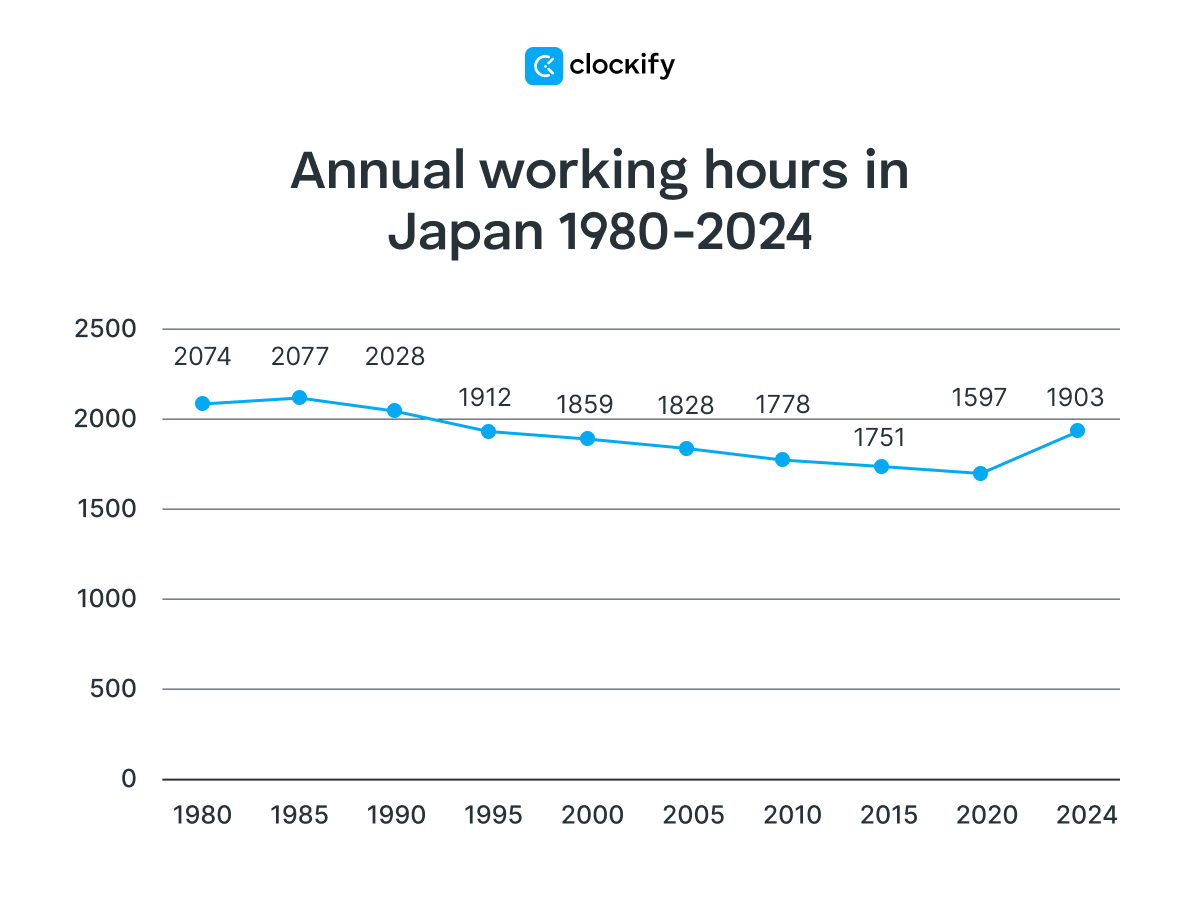
Compared to 1980, there was a decrease in annual working hours of 8% in 2024. However, there’s an increase of 19% since 2020.
Working hours in China
In the case of China, an average full-time employee spends about 2,397 hours a year or 46.1 hours a week working.
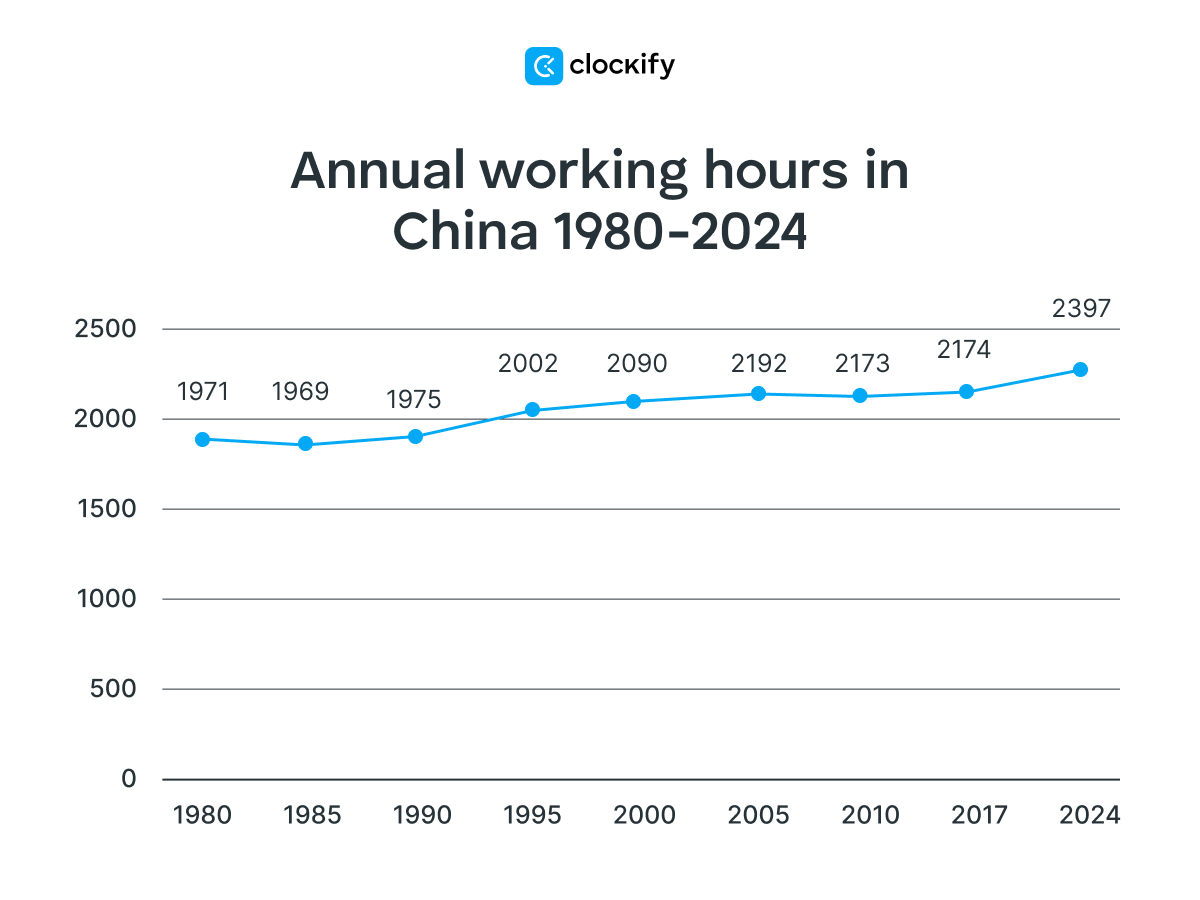
China’s 2024 annual work hours marked an increase of 22% since 1980 as well as an increase of 10% since 2017.
Working hours in India
When it comes to India, a full-time employee has an average work week of 46.7 hours, which translates to circa 2,428 annual work hours.
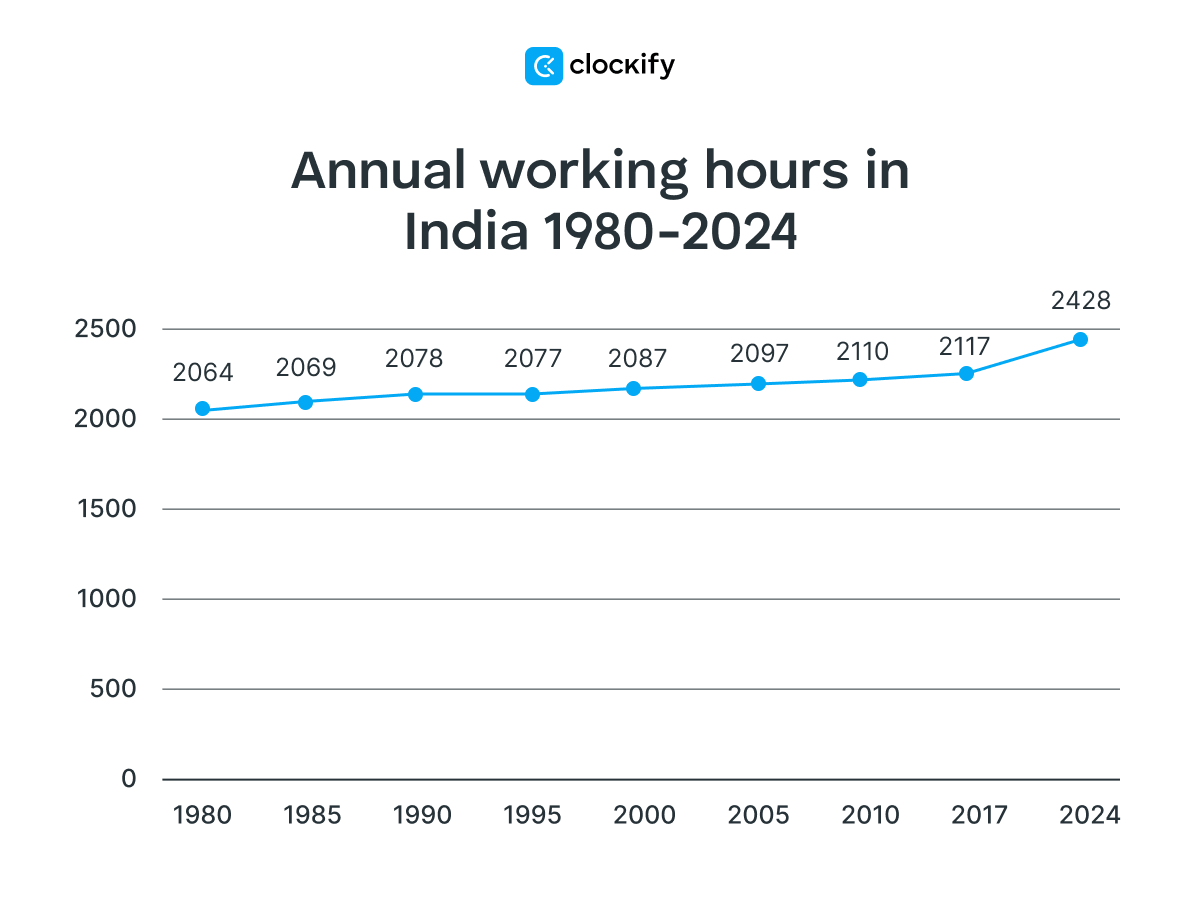
India’s case is similar to China’s. There was an increase in 2024 annual work hours since both 1980 and 2017 — namely, 18% and 15%.
Working hours in Canada
A Canadian full-time employee works 32.1 hours a week on average, or about 1,669 hours a year.
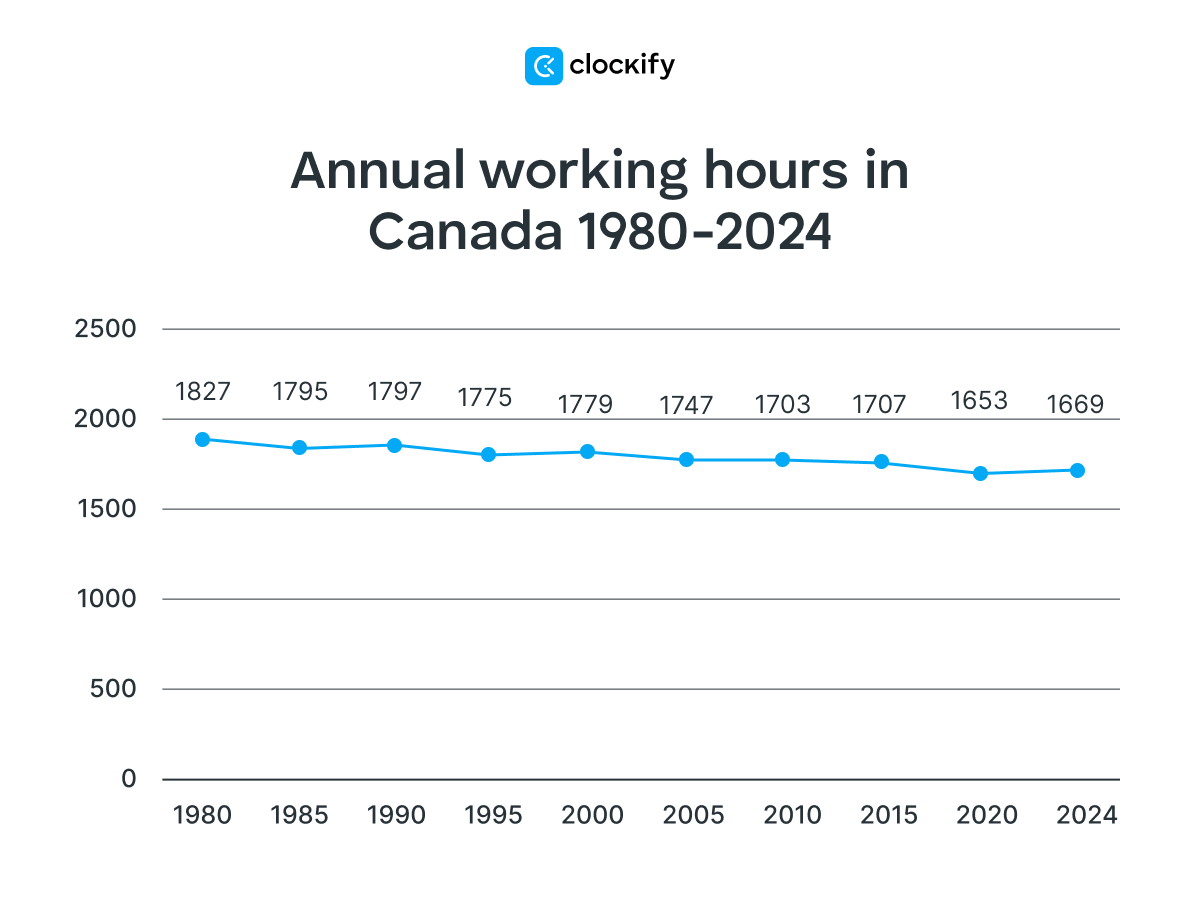
In 2024, Canada had a significant decrease in annual work hours compared to 1980 — 9%. However, there was a slight increase since 2020 — 1%.
Working hours in the US
A full-time employee in the United States works 1,976 hours per year, or 38 hours per week, which is a bit more than most other OECD countries.
While FLSA doesn’t define the number of weekly work hours an employee needs to work to be considered a full-time worker, the Internal Revenue Service (IRS) states that full-time employees spend a minimum of 30 hours per week (or 130 hours per month) working. Overtime, on the other hand, is FLSA-regulated at more than 40 work hours per week.
On average, employees from the US work about 62 hours per year more than workers from the EU.
Working hours statistics by industry in the US
According to the most recent US Bureau of Labor Statistics data, employees working in the mining and logging industry in the US worked the longest hours — 43.7 weekly hours on average in January 2025.
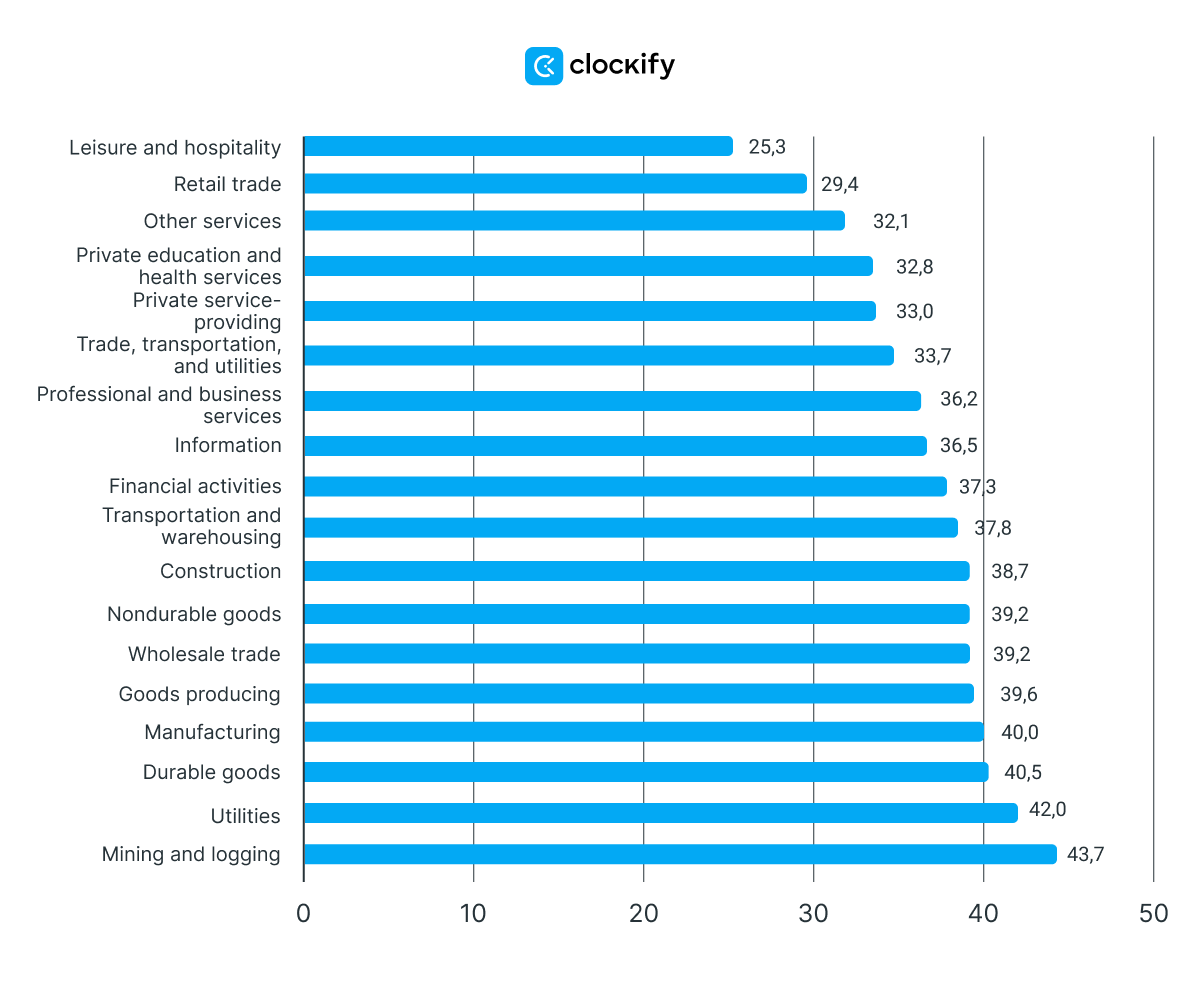
On the other hand, leisure and hospitality workers in the US have the least working hours — 25.1 weekly hours in January 2025.
🎓 How Many Work Hours Do You Work in a Year?
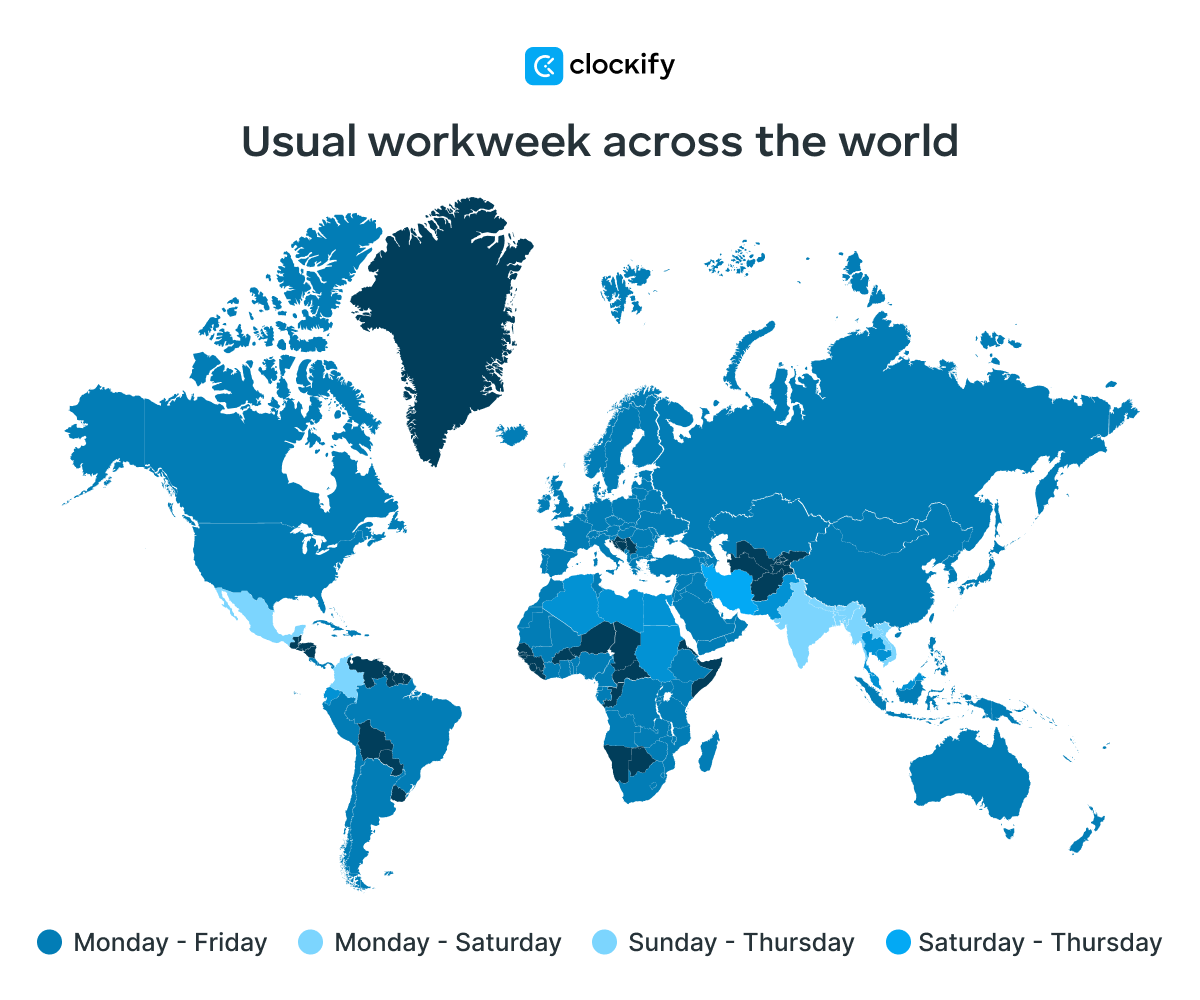
Weekdays and paid time off by country
Workdays and weekends differ by country. Although Saturday and Sunday are most commonly regarded as the weekend in most countries, for some, these are still workdays.
In most of the world, the workweek is from Monday to Friday. However, in Muslim-majority countries, the usual workweek is from Sunday to Thursday.
Also, some countries work 6 days per week, while some offer a 4-day workweek, such as Belgium and Denmark.
🎓 Everything You Need to Know About the 4-Day Workweek Concept
Most countries in the world have laws that set the maximum length of the workweek and the minimum paid vacation, except for the United States.
Based on the World Policy Center’s data tables, the US is the only industrialized country in the world that doesn’t have legally mandated annual leave and doesn’t guarantee its workers paid vacation.
Recent statistics about average vacation days by country in 2024 show that European countries, on the other hand, mandate a minimum of at least 20 paid vacation days per year (some even go higher to 25 or even 30 or more days).
Australia and South Korea, for instance, also require employers to grant at least 20 vacation days per year, while Canada and Japan mandate at least 15 paid days off.
In addition to mandated paid annual leave, workers also get paid time off for public holidays.
For instance, the FLSA doesn’t require private US employers to offer paid holidays to their employees. However, most developed countries offer at least 6 paid holidays per year (while some countries, like Cambodia and Iran, offer 27 paid holidays).
🎓 What are paid holidays and how do they work?
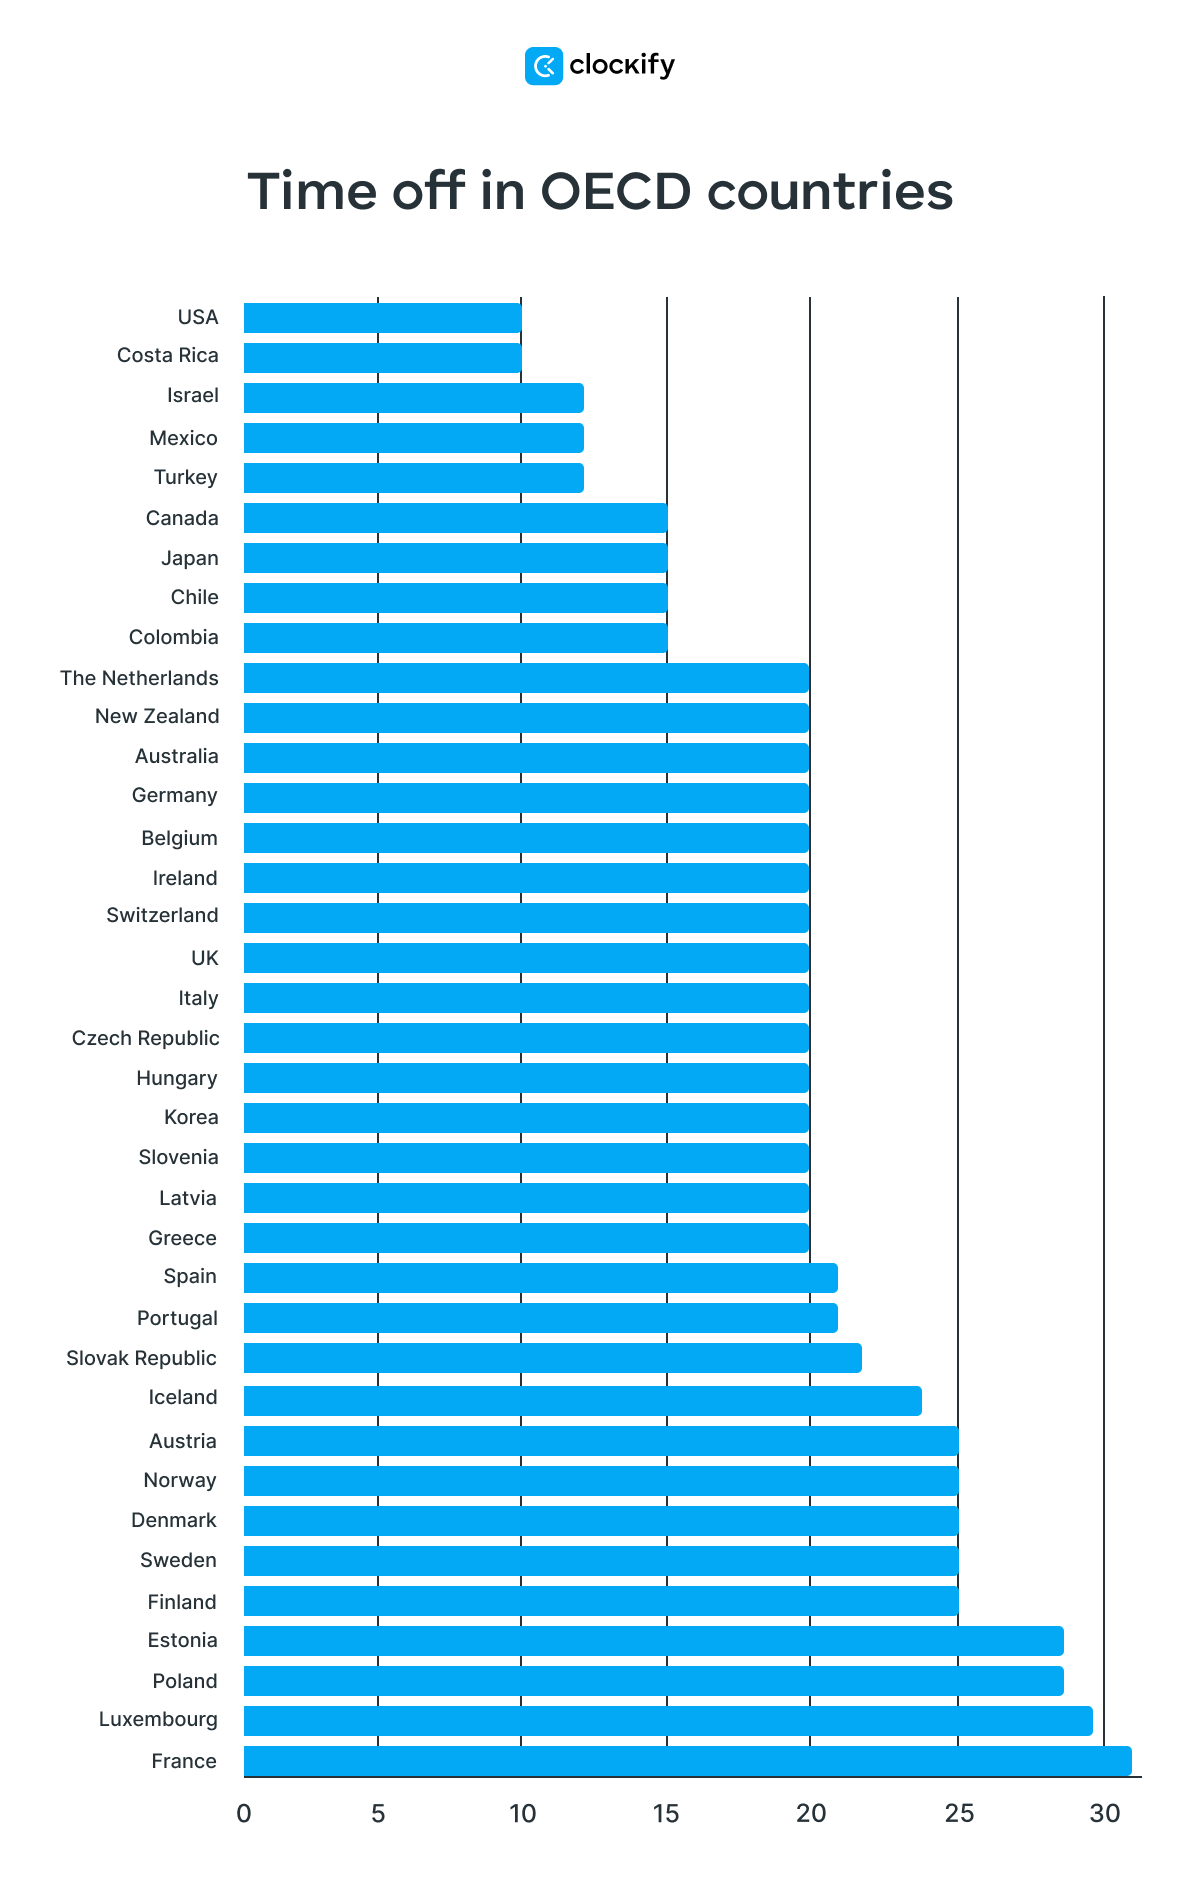
In the absence of government standards, 28 million Americans don’t have any vacation or paid holidays. According to the US Bureau of Labor Statistics, the average US worker receives only about 10 days of paid vacation per year (after a year of service) — less than the minimum legal standard set in the rest of the world's rich economies.
In the graph below, you can see how the USA compares to other OECD countries’ paid vacation days.
Productivity and working overtime
A longer working week doesn’t necessarily result in higher levels of productivity.
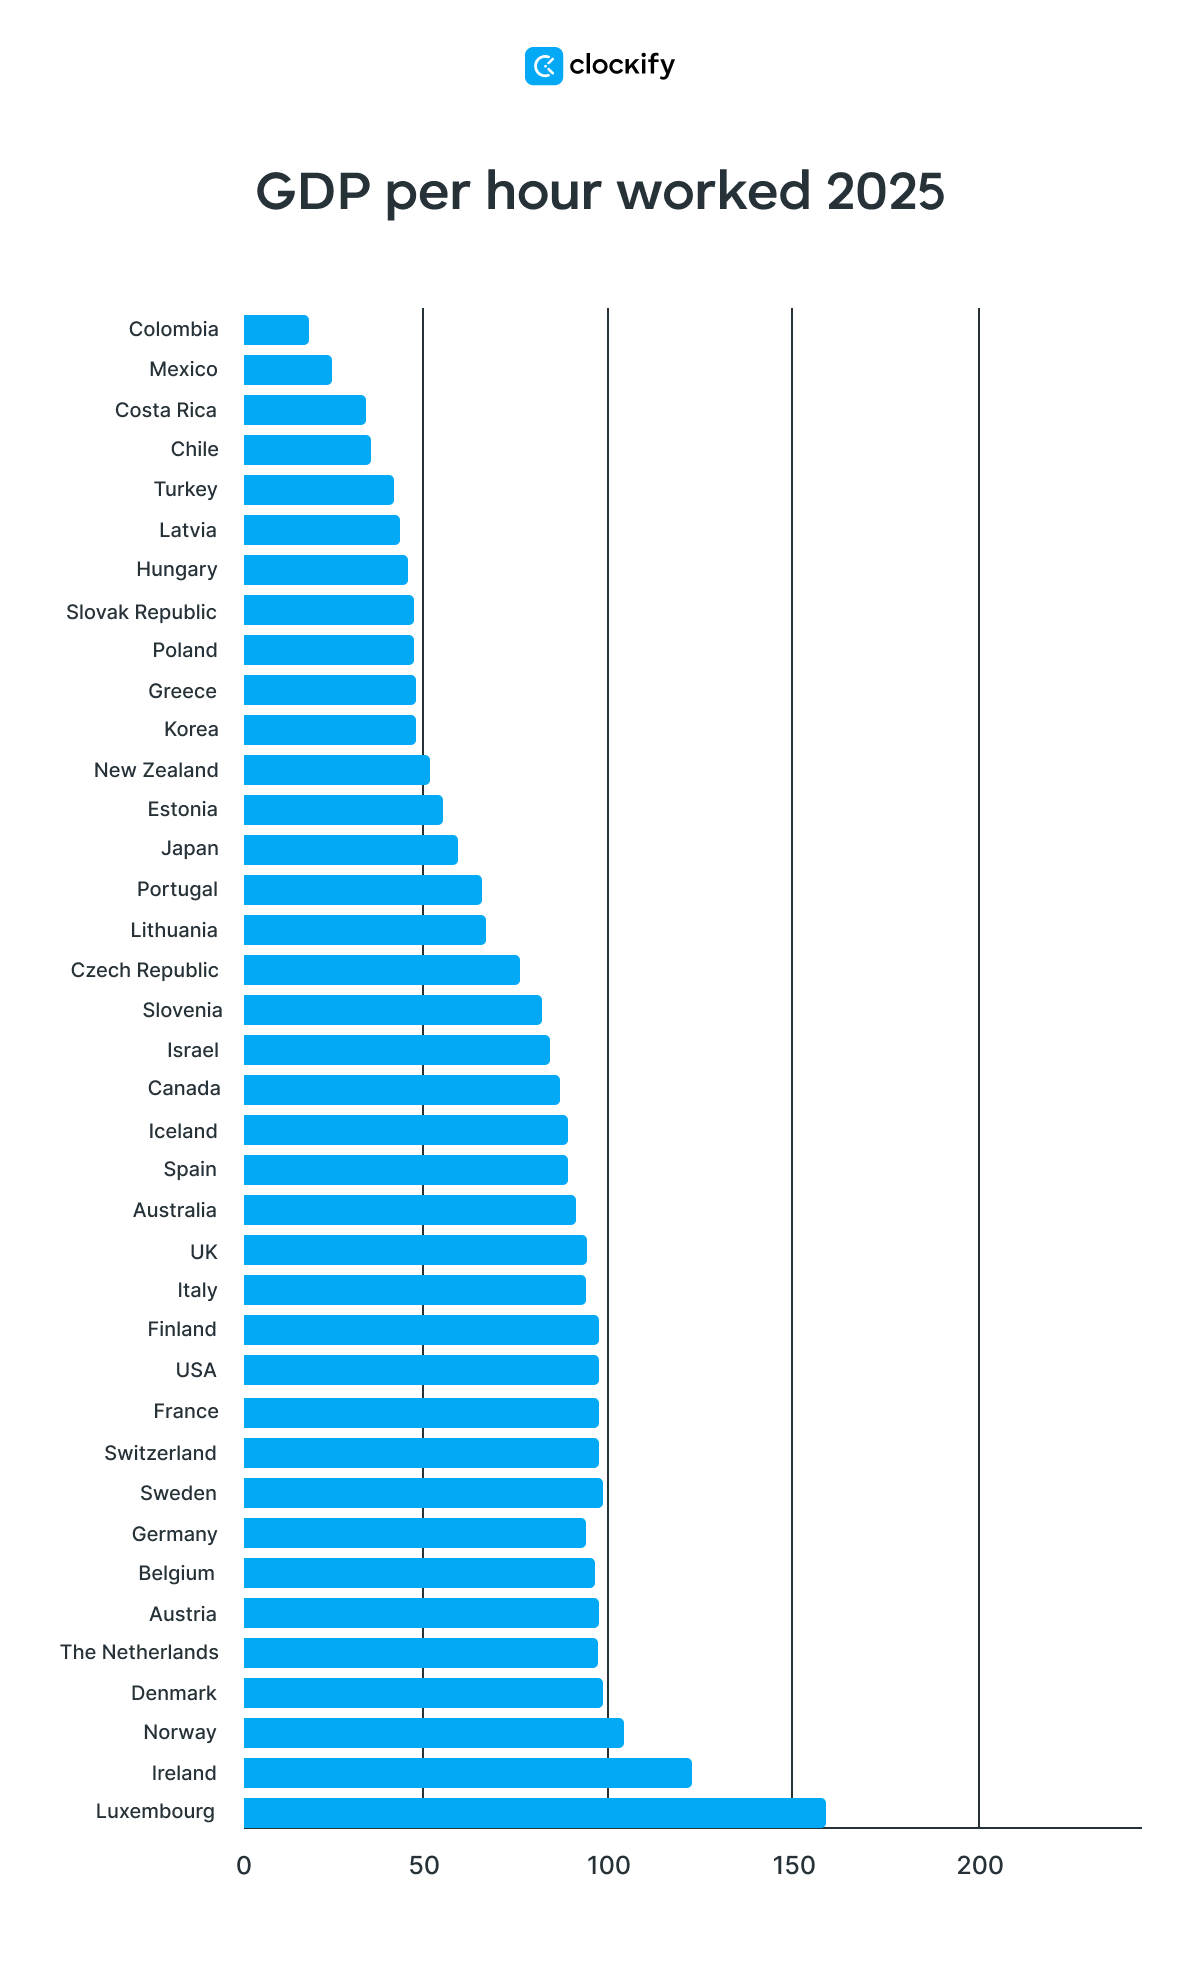
For example, workers in Mexico have quite long annual shifts (2,272 hours/year), but their GDP per hour is among the lowest.
As productivity increases, working hours decrease. For example, employees in Luxembourg and Ireland work 35.6 hours per week on average (1,851 hours/year), but their GDP per hour is the highest in the world.
The graph below shows the GDP per hour worked in 2025, provided by ILO’s labor productivity statistics.
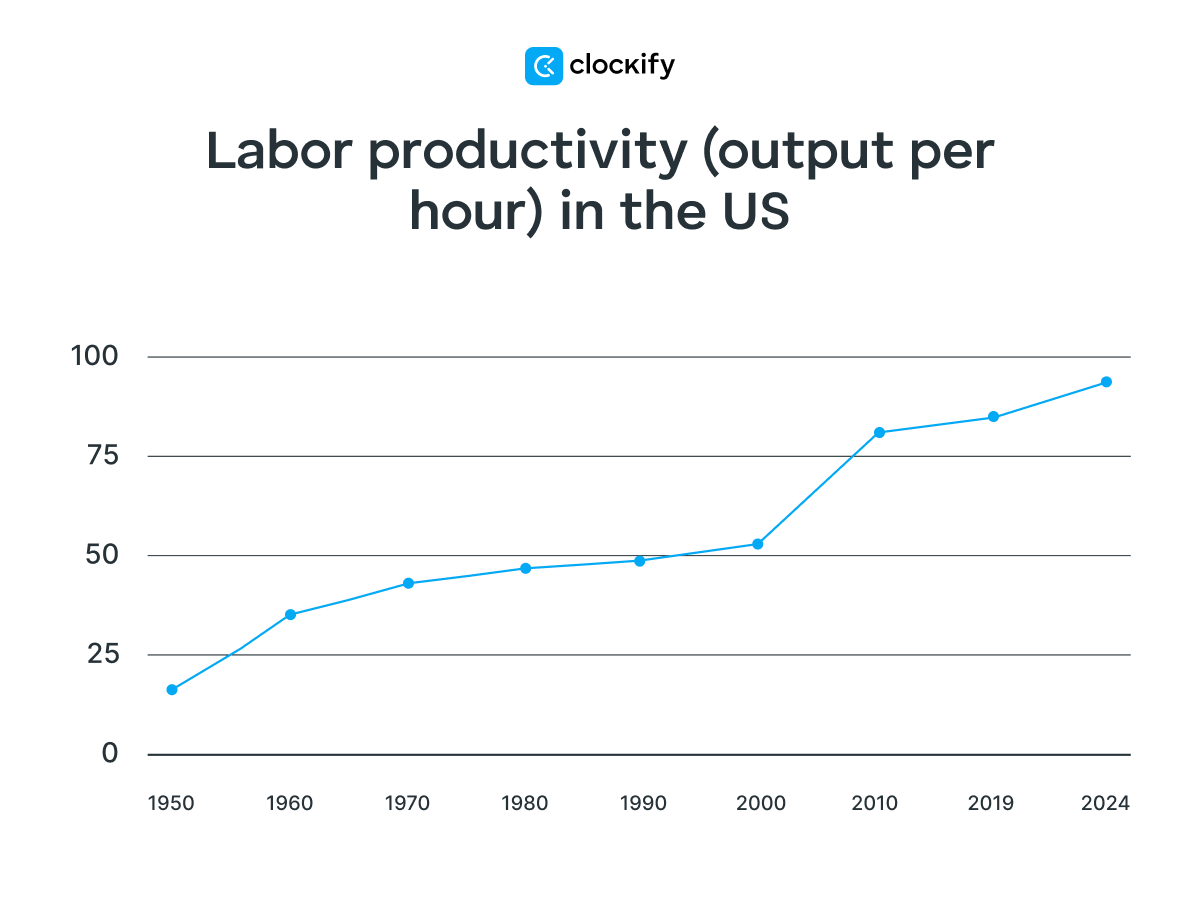
However, productivity levels haven’t always been as high as today. In fact, Our World in Data shows that labor productivity has been increasing exponentially since the 1950s.
According to the US Bureau of Labor Statistics productivity findings, in the last quarter of 2024, labor productivity (output per hour) in a nonfarm business sector increased by 1.2%. The increase was also noted in the manufacturing sector by 0.8%.
But productivity growth hasn’t necessarily reduced work time.
For instance, 2024 research suggests workers in Europe put in 6.8 hours of unpaid overtime work every week. Furthermore, at 9%, the US has a relatively high percentage of employees who aren’t satisfied with their job security — the global share is below 6%.
🎓 Overtime Calculator | Should I work overtime without pay?
FAQs about work hours
If you’re looking for more information about work hours, check out the following section.
Is working 50 hours a lot?
FLSA doesn’t regulate the number of work hours an employer can demand their employees to work. However, the pay is regulated, with anything over 40 hours a week considered overtime. Even if it’s compensated, working 50 hours a week can cause fatigue, lower productivity and alertness, and sometimes even health problems, according to the Occupational Safety and Health Administration (OSHA).
Is a normal work day 8-5 or 9-5?
OSHA states that employees shouldn’t work more than 8 consecutive hours (over 5 days and at least 8 hours of rest in between shifts). This can be the case with both 8-to-5 and 9-to-5 work schedules. The only difference is that with an 8-to-5 work schedule, employees have an hour of unpaid lunchtime. In the end, the choice between the two lies with the employer and workplace policies.
Is working 80 hours a week illegal?
FLSA doesn’t regulate the number of hours worked, so if you agree to work 80 hours a week, it’s legal to do so. That’s not the case everywhere in the world though. For example, in the UK, you can’t work more than 48 hours a week.
How many hours is overworking?
Long working hours, meaning those that extend over 40 hours a week, can negatively affect one’s physical and mental well-being, according to OSHA.
Use a time tracker to calculate working hours in 2025
Even though working hours vary across countries, they’ve decreased since the 19th century. Compared to an average 1850s worker who used to work more than 3,000 hours per year, a 2024 employee spent less than 2,000 hours at work on average.
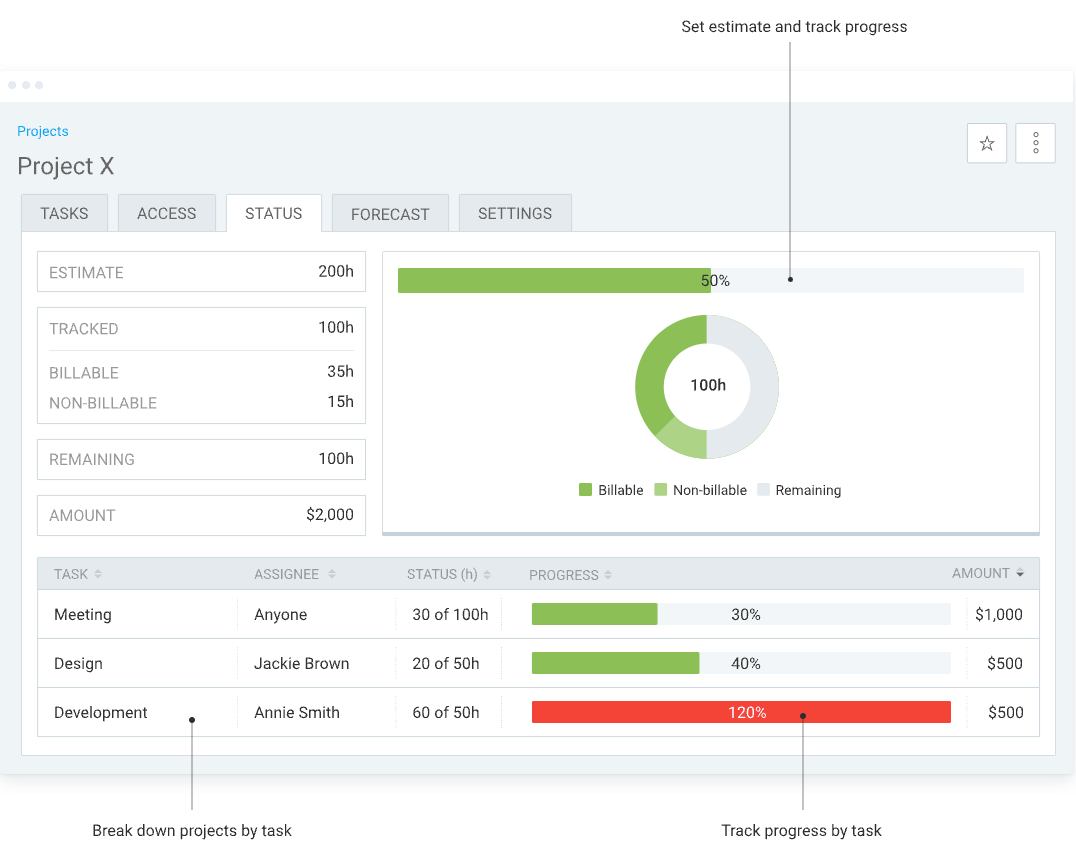
Tracking daily work hours is now easier than ever, thanks to tools like Clockify.
Whether you’re managing a packed schedule, tracking billable hours, or simply curious about where your time goes, Clockify helps you stay on top of it all.
With its intuitive time tracker, detailed reports, and project organization features, you can gain better control over your work hours — without extra stress.
As work trends continue to evolve, using tools like Clockify ensures you stay productive while maintaining a healthy work-life balance. After all, if history has taught us anything, it’s that time is precious — so why not track it wisely?