
The utilization rate is the percentage of work hours spent on billable or productive tasks. Calculating this rate helps you:
- Estimate team or company performance,
- Identify if you’re losing money,
- Allocate resources more efficiently, and
- Manage your team more effectively.
Let’s take a look at different types of employee utilization rates, how to calculate them, and how to use them to improve your business.
What is the utilization rate?
Utilization rate (or utilization time) is the percentage of a person’s or team’s working hours spent on billable or productive tasks compared to 100% of their available work time. In fact, it’s one of the key performance indicators of a business.
Utilization rate measures how much of an individual’s or team’s available capacity is used productively on a daily, weekly, monthly, quarterly, or annual basis. It can also tell you if a department or team is spending too much time on non-billable tasks.
If this rate is too low, you’re likely losing money on payroll. But if this rate is too high, you are likely burning out your team and sacrificing long-term quality for short-term gain.
However, there are multiple utilization rate formulas that focus on different things: revenue, contribution, or workload. Let’s take a closer look at each.
💡 CLOCKIFY PRO TIP
Need a clearer distinction between billable and non-billable hours? Check out our blog post:
How to calculate utilization?
There are many ways to view and calculate employee utilization. Let’s explore the most important formulas so you can pick the ones that are most relevant for your company.
Type #1: Billable utilization rate
With a focus on revenue, this is the most common utilization rate used by agencies, law firms, and consultancies. It’s also called the standard employee utilization rate.
The billable utilization rate formula shows you how many of an employee’s or team’s worked hours contribute to billing your clients directly.
Billable hours / Total available working hours x 100 = Billable utilization
The same formula applies to weekly, monthly, quarterly, or yearly billable utilization — it just requires different input data for different time periods. Let’s take one workweek as an example:
- Billable hours represent time spent on billable tasks during the week you’re analyzing. For accurate results, this formula requires you to track billable and non-billable tasks beforehand.
- Total available working hours in this formula refer to the standard 40-hour week (excluding public holidays and PTO). This number can vary by job and employment type.
So, if an employee works 40 hours a week and spends 30 hours on billable tasks, their weekly billable utilization rate would be:
30 (Billable hours) / 40 (Total available working hours) x 100 = 75% utilization rate
This formula ensures that the revenue generated by an employee covers their salary and overhead expenses, while still contributing to profit. This rate is closely related to your profit margin. It’s often used as an employee utilization formula, but it’s also suitable for teams or entire departments.
In theory, the ideal utilization rate for this formula is 70–80%. If the rate is much lower, there’s room for improvement. But if this rate gets too high, you’re putting people in burnout territory. Long-term, this is unsustainable for any business.
According to Tom Bukevicius, founder of a digital marketing agency, the best way to actually apply the formula is to analyze both individuals and teams.

“I always cross-check utilization with campaign performance. If utilization is high but results are flat, the team is busy but not effective. Also, one person at 90% and another at 50% is not a healthy system, even if the average looks fine.”
Tom states that analyzing multiple angles helps spot imbalance early, rather than pushing everyone to hit a target number.

Type #2: Productive utilization rate
Focusing on contribution, the productive utilization rate (aka overall utilization) accounts for internal growth, mentoring, and administrative work that keeps your company running.
The formula for the productive utilization rate is:
Billable hours + Productive non-billable hours / Total available working hours x 100 = Productive utilization
To calculate this value, the formula also requires you to track productive non-billable hours separately from regular billable hours. Productive non-billable hours can include anything from:
- Mentoring junior staff,
- Internal projects,
- Business development,
- Research, or
- Networking.
That said, productive non-billable hours can be anything you deem productive for a particular worker, despite it not being directly paid for by your clients.
The productive utilization rate formula acknowledges that an employee is still using their time effectively — even if it doesn’t generate direct profit. Productive utilization helps you identify employees who are high-value company builders, even though they might look underutilized on a strictly financial spreadsheet.
Check out our quick billable vs. non-billable utilization comparison table for reference.
| Billable utilization | Non-billable utilization |
|---|---|
| Coding software, writing copy, designing graphics, drafting legal documents | Filling out timesheets, submitting expense reports, managing payroll |
| Scheduled phone calls, video conferences, or substantive email correspondence regarding project status | Attending industry conferences, webinars, or undergoing certification training |
| Project-related research, data analysis, building project roadmaps | Writing proposals, preparing sales pitches, networking to find new clients |
| Kick-off calls, progress reviews, final client presentations | Improving internal processes, implementing new company software, fixing internal workflow problems |
Both of these categories are essential for a business to function and develop.
Seniority is also a factor: A junior employee will often have a higher billable utilization rate than a senior. While juniors spend most of their time completing billable tasks, a senior could focus on mentorship and strategy. However, both types of work are equally important.
Co-founder of an ad agency and our expert contributor, Mark Voronov, underlines just how important it is to take this into account:

“The disparity in utilization expectations between juniors and seniors exists regardless of industry. Operations leaders who fail to consider that will end up with impressive-looking numbers but payroll problems nonetheless.”
Keep this in mind to make the right call when running utilization calculations and analyzing productivity.
Type #3: Capacity utilization rate
Capacity utilization is a broader formula focusing on the workload of groups rather than individuals. In its most common variant, the formula represents the average billable or productive utilization of a group, team, or department.
The simple formula for capacity utilization is:
Sum of multiple individual utilization rates / The number of employees summed = Capacity utilization rate
This isn’t the only capacity utilization formula, but it’s by far the simplest one. This formula helps you gain a broader perspective on whether your team is in the 70–80% utilization rate sweet spot.
This simple formula can be used to determine:
- Billable capacity utilization — to see the average profitability of a department or company, or
- Productive capacity utilization — to see if there’s room for improvement in terms of contributions in teams or company-wide.
💡 CLOCKIFY PRO TIP
Looking for a way to instantly calculate shifts based on daily capacity? Check out our easy solution:
Type #4: Ideal utilization rate
The concept of ideal utilization has different definitions depending on your sources. For most businesses, the ideal utilization is the perfect balance between spending time on billable tasks and on administrative or non-billable work.
With an average utilization rate of 80% or less, your workers are at their most productive, make fewer mistakes, and have the time and energy left to handle unexpected situations.
Theoretically, there are multiple ways to calculate the ideal utilization rate. The most common ideal utilization rate formula is:
(Costs + Profit) / (Potential capacity x Billable rate) x 100 = Ideal utilization rate
In practice, this is fairly tedious to calculate and difficult to track. Also, “the higher the number, the better the work” is definitely a false claim in this case.
For example, having a utilization rate below 50% can seem like the end of the world — but it’s far from it. According to a 2026 Clio report, the average utilization rate in the legal sector is 38%. That’s approximately 3 billable hours in an 8-hour workday. Other industries, like consulting, IT, and marketing, also occasionally report numbers below 70%.
In contrast, a utilization rate close to 100% likely indicates an overworked staff on the verge of career burnout.
So, the best way to think about utilization rates overall is in context. Identify the main problems. Ask difficult questions, such as:
- What is lacking in your business or department?
- Are you losing revenue?
- Is the entire department under severe stress?
- Is the work evenly distributed?
- Are deadlines achievable?
- Are people unmotivated?
- Are teams disorganized?
After you narrow down your main productivity killers, rely on utilization rate formulas for a second view. These formulas are best used to confirm the problems you suspect, not as the only guides.
💡 CLOCKIFY PRO TIP
Want to measure how someone’s performing? Use our free employee performance calculator:
What is the realization rate?
Realization rate represents the ratio of all billable hours to the money actually charged to your customers or clients. The formula for the realization rate is:
Total billed hours / Total billable hours = Realization rate
Although not a utilization rate formula, this rate is often used alongside billable utilization for an entire company.
In reality, you can have a 90% billable utilization (indicating overworked people), but if your realization rate is only 60%, your business is effectively operating at a loss.
According to our expert contributor Randy Bryan, founder of a cybersecurity company:

“A technician can look 80% utilized on paper while quietly delivering poor outcomes that churn clients. If task resolution rates drop while utilization stays high, your people are overloaded and quality is slipping.”
Low realization rates happen when:
- Projects don’t get finished or billed properly,
- Projects take too long because of employee skill gaps,
- Project duration is wrongly estimated,
- Fixed fees don’t cover labor and overhead costs,
- You provide too many hours of cheap or free extra work,
- People spend too much time on non-billable activities across the company.
You can counter the effects of low realization rates by reorganizing and standardizing workflows and switching your pricing models.
Estimate utilization with Clockify
What is a good employee utilization rate?
Sources report vastly different target utilization rates for different industries. Below, we’ve gathered data from various reputable sources as a reference point. These numbers are rough estimates of what you should generally strive for in your industry — also known as the “utilization goldilocks zone.”
| Industry | Applicability | Target utilization rate |
|---|---|---|
| Consulting | Juniors & individual contributors | 65–75% |
| Consulting | Seniors | 80–90% |
| Legal | Juniors & associates | 75–85% |
| Legal | Seniors & partners | 65–75% |
| IT services | Company-wide | 70–80% |
| Creative | Company-wide | 70–80% |
| Marketing | Company-wide | 70–80% |
Keep in mind that this data represents broad benchmarks. The ideal utilization rate will depend on the employee role, industry, and other specific factors.
In practice, it’s best to combine billable utilization with other formulas to get the full picture before making strategic changes.
What are the benefits of monitoring the utilization rate?
Monitoring your utilization rate in real time helps you become more proactive and catch mistakes before they become serious problems.
Tracking utilization is beneficial because it:
- Protects the people. It helps you see burnout coming before it happens, distribute work fairly, and identify skill gaps in diligent workers.
- Keeps tabs on resource costs. It makes sure you are neither underusing nor overusing resources while staying within budget.
- Adjusts the profit margin. If your utilization rate is high but your profit margin is low, operating expenses or undercharging for your services might be the problem.
- Supports business growth. The utilization rate can help you identify teams that require more staff and understand which departments contribute the most to revenue.
- Enhances project planning. Utilization calculation helps you identify if too many employees are working on the same project or unimportant tasks that take up their time and attention.
What is a utilization report?
When monitoring utilization, one handy tool is the utilization report. A utilization report is a document that helps you determine exactly how much of the time allocated to a team or individual is scheduled, available, and used effectively.
A utilization report can be made up of several data points that demonstrate team utilization:
- Billable hours — time directly charged to a client for project work,
- Non-billable productive hours — non-billable work that benefits the company, like business development or training,
- Administrative/overhead hours — non-billable but necessary internal tasks like internal meetings and bookkeeping,
- Billable utilization — percentage of total available hours spent on billable tasks,
- Capacity utilization — percentage of all employee hours against their total available capacity,
- Target vs. actual utilization — comparison between planned billable goals and real hours recorded, and
- Non-billable utilization — work hours spent on non-billable work (meetings, staff development/training, networking, attending conferences, etc.).
These data points can help you estimate whether you need to make a business decision to avoid potential consequences. Take a look at our reference table for practical examples on how to create a utilization report.
| Data point | Business decision it influences |
|---|---|
| Billable hours | If too low: Investigate whether you’re making enough money to cover payroll and overhead. |
| Non-billable productive hours | If too low: Indicates little time spent on growth and innovation. |
| Administrative/overhead hours | If too high: Internal processes might be eating into your profits. |
| Billable utilization | If too low: You might need more sales or higher rates. |
| Capacity utilization | If too high: You may need to expand your team to prevent burnout. |
| Target vs. actual utilization | If too different: Individual coaching or workload adjustment is likely necessary. |
Create detailed utilization reports
The utilization report can refer to individuals, teams, departments, or the whole organization. So, the final form of the report will vary depending on its recipient. An external client will likely get different data than a VP or CFO. A flexible time tracker like Clockify helps you generate custom reports that run calculations for multiple needs.
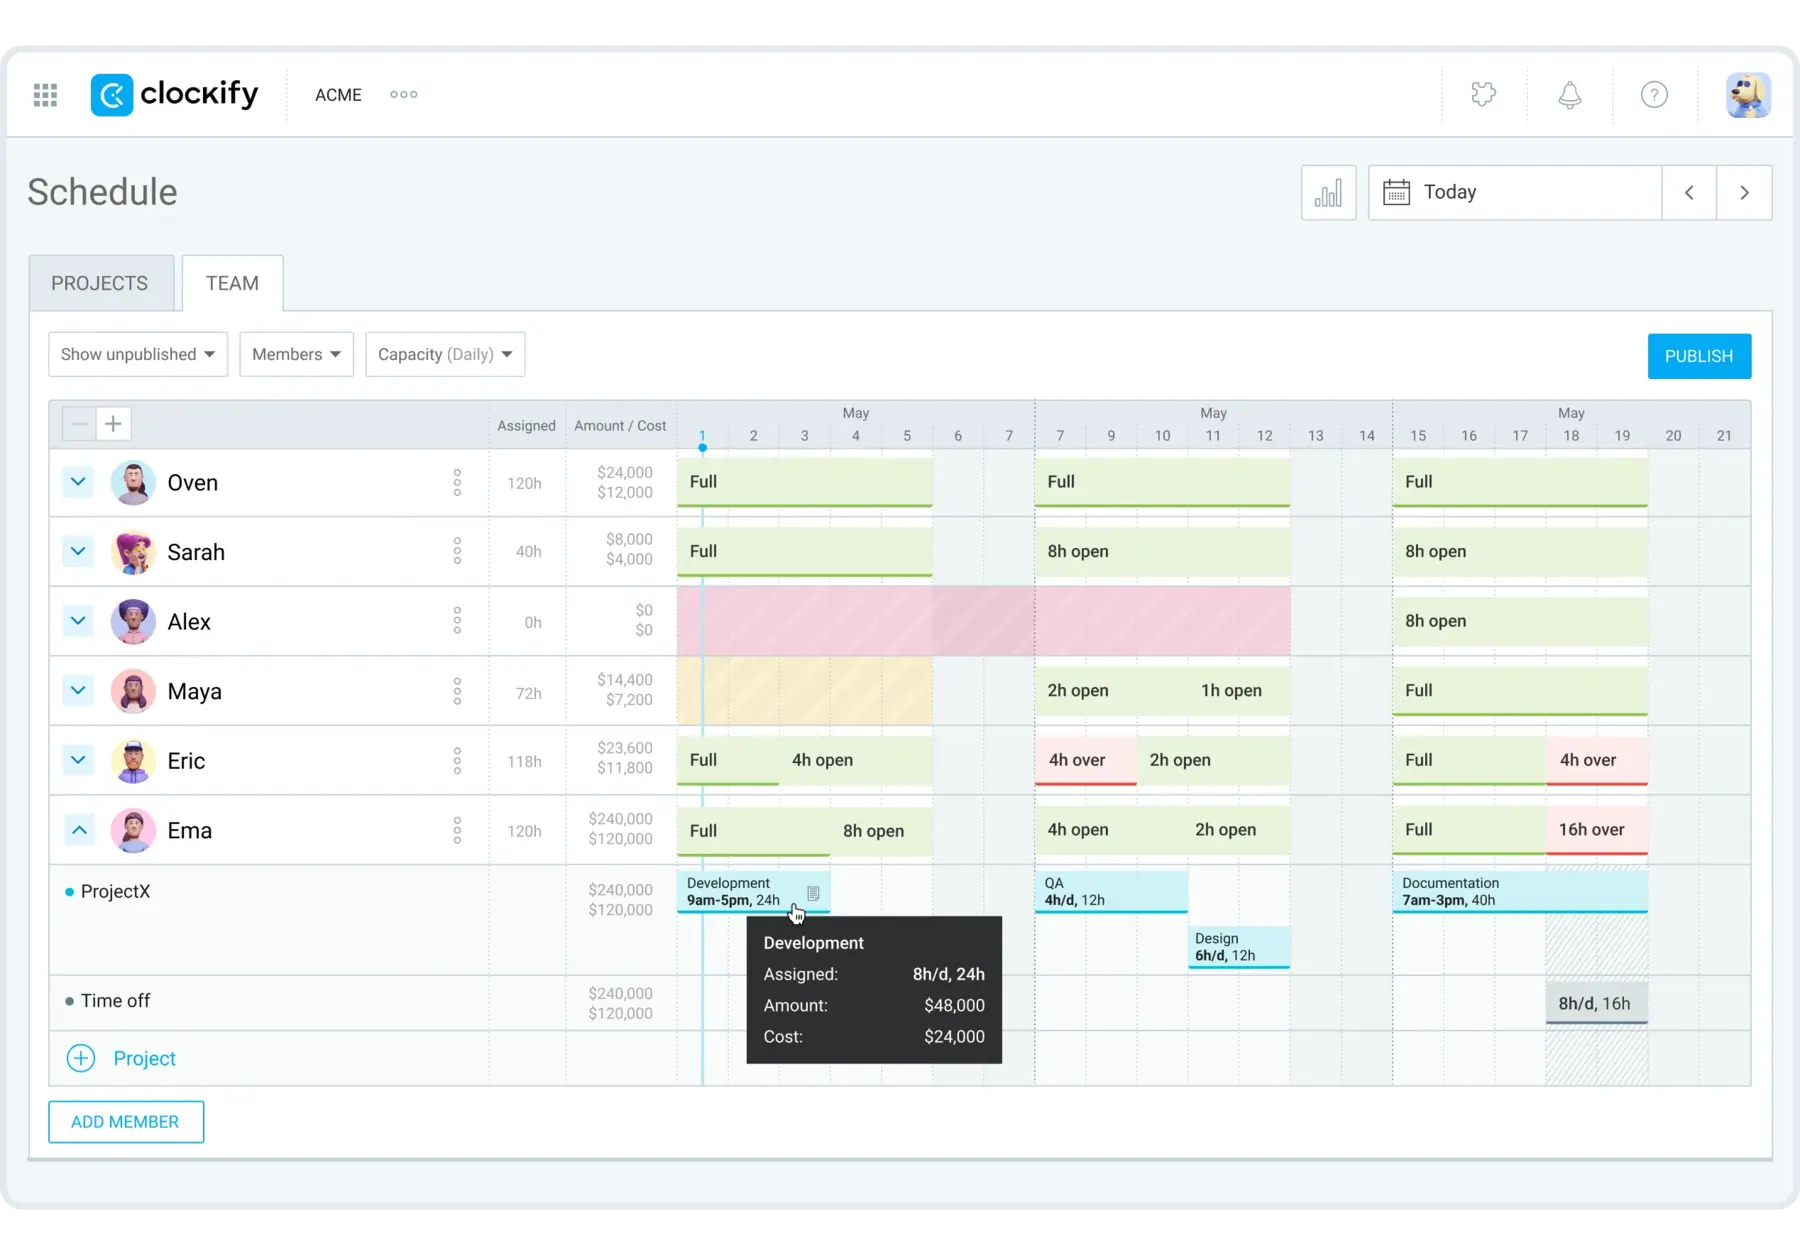
Project forecasting skills are also among your most important assets when creating utilization reports. Instead of manually estimating project timelines, managers can use a team scheduling app to distribute their team’s workload more effectively.
Clockify’s Scheduling lets you see each employee’s daily capacity and assign projects to their specific hours, while leaving time for breaks or productive, non-billable tasks.
Tips to improve employee utilization rate
As a team leader, you’re in charge of finding ways to enhance employee productivity and morale. Consequently, this improves utilization rates team-wide. Let’s take a look at the practical steps to achieve this.
#1: Track time to assess improvement areas
Before you can calculate utilization rates for improvement, you need to track time and label hours as billable, non-billable, and productive non-billable. This is best achieved by implementing a reliable timekeeping system like Clockify:
- Employees log the time they spend on tasks daily or weekly,
- Managers review and approve that time,
- Department leads create utilization reports when investigating ways to improve output or work distribution.
Of course, the ratio of billable to non-billable time can vary significantly across projects and roles.
To make it work, implement time tracking for everyone, then calculate and review team and employee utilization rates. Then analyze which departments need to work more and which teams are overworked.
For this assessment, you can rely on billable, productive, and capacity utilization rate formulas.

#2: Compare estimated vs. actual time
You might think you know how much time someone will need to complete an assignment. However, you’ll probably be shocked when you start comparing expected vs. actual time for everything your team does.
Both overestimating and underestimating the time your team needs can cause problems:
- Underestimating time can result in undetected project issues and inaccurate billing, while
- Overestimating time can result in low productivity and slow down business expansion.
If you run the numbers, you’ll likely see this reflected in broader utilization rate formulas, like the capacity utilization rate.
Comparing estimated vs. actual time can help you spot if you’re losing crucial hours at every step and at every level of team responsibility.
By implementing a powerful task tracker, you can measure how well your team is performing by:
- Estimating the time needed to complete a project,
- Tracking individual and group progress, and
- Comparing expected and actual time.
Clockify’s Time estimates are a massive help here, especially as your project evolves and becomes more complex.
#3: Reorganize roles, responsibilities, and scope
Achieving optimal utilization is impossible if staff members struggle to understand their roles. This includes their job objectives and responsibilities.
To help your team avoid confusion, provide clear task details and an unambiguous explanation of job duties. Well-defined roles and tasks can also help you determine whether you have organizational issues or too many/too few workers.
It’s equally important to match employees’ social skills with their job roles. For instance, an extroverted, imaginative, and creative person could be great at presenting ideas to clients but struggle with rule-intensive, detail-oriented assignments.
💡 CLOCKIFY PRO TIP
For more insights on managing your employees’ time properly, read this:
#4: Make tasks more meaningful to boost productivity
Instead of spending too much time on less important tasks, prioritize assignments that benefit the business.
When possible, avoid delegating too many small, mundane tasks to a single person. This is especially important if they have something more urgent or complex to focus on.
As a rule of thumb, follow this simple organizational checklist:
- Examine your team’s daily schedule,
- Determine the most important tasks for each individual,
- Check their deadlines,
- Assess broader project deadlines, and
- Reschedule less important activities or assign them to someone less busy.
Meaningful work increases employee motivation, which directly boosts performance.
Estimate project timelines easily
#5: Compare monthly improvements and optimize
To confirm if your strategy is improving your team, make sure to:
- Calculate the monthly or weekly utilization rate before you implement any changes.
- Do the same calculation for the week or month after implementing your changes.
- Compare the results to see how much your team has improved.
- If utilization differences are too low, adjust your strategy, and repeat.
Although numbers don’t lie, you’ll likely see major improvements in practice before you even reach for the calculator.
💡 CLOCKIFY PRO TIP
To discover how to estimate team utilization with Clockify features, check out our article:
Track employee utilization with Clockify by CAKE.com
Utilization rate formulas are a useful way to pinpoint employee performance. But to understand what makes your company tick, you need a time tracker that collects, analyzes, and reports time.
With Clockify by CAKE.com, you can track employee utilization in a few simple steps:
- Set up Projects by marking them as billable or non-billable,
- Assign people to projects so they can log their hours,
- Let employees track time assigned to projects,
- Authorize managers to review time to ensure accuracy, and
- Run reports to plan improvements with insights deeper than any formula.
Clockify’s Summary and Detailed reports automatically calculate from your tracked data. They allow you to include and compare:
- Billable and non-billable hours,
- Expenses,
- Teams and performance,
- Individual contributions,
- Profits vs. costs, and so much more.
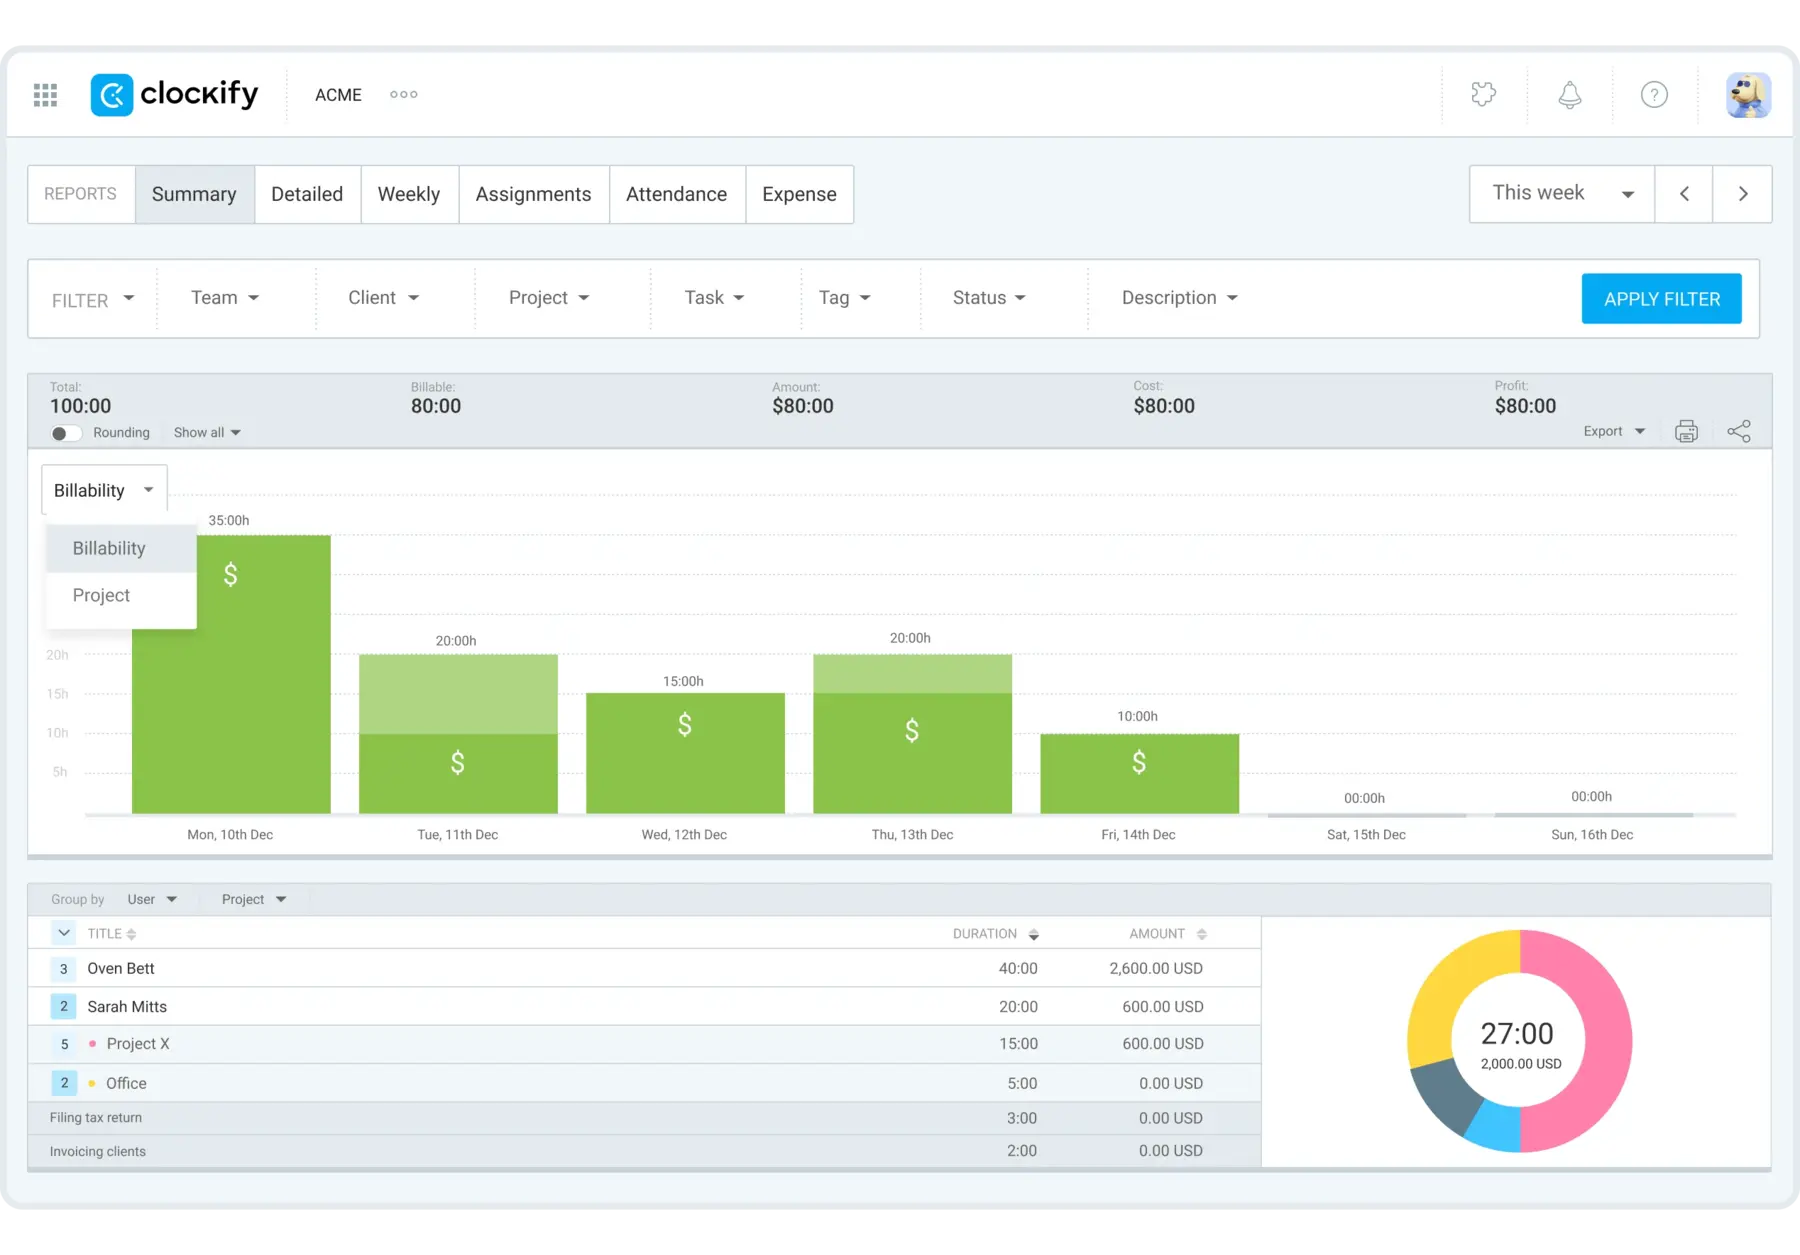
You can combine filters however you like to generate reports for different purposes. Improve internal processes, share a Clockify report link, or export as Excel, PDF, or CSV to send to external clients or stakeholders.
To distinguish between non-billable and productive non-billable hours, you can also use Clockify’s Custom fields and assign them to projects dedicated to your supporting teams.
Clockify offers a 7-day free trial for new users, so you can try the advanced reporting firsthand with no limits.
FAQs about the utilization rate
Finally, let’s answer the most commonly asked questions about the employee utilization rate.
How do you calculate employee utilization?
You can use multiple formulas to calculate the utilization rate for a person, a team, or the whole company. The most common utilization rates are:
- Billable utilization rate — billable hours divided by total work hours available.
- Productive utilization rate — all non-billable productive work hours divided by total work hours available.
- Capacity utilization rate — a group’s total time spent on productive work divided by the number of people in that group.
Is 100% utilization good or bad?
A 100% employee utilization rate is often associated with burnout and efficiency. Long-term effects of overutilization include:
- Increased errors,
- Reduced innovation,
- Lack of professional development or internal improvements,
- Lack of room for unexpected tasks or emergencies, and
- High turnover rates.
What is a reasonable utilization rate?
Depending on the job, seniority, and role, a reasonable utilization rate falls between 70% and 80%. The 20–30% window leaves room for tasks such as professional development, internal meetings, and administrative work.
What does 80% utilization mean?
An 80% utilization means that an employee spends 80% of their available work hours on tasks that generate revenue (billable utilization) or tasks deemed productive for their role (productive utilization).
Can utilization be more than 100%?
When the utilization rate exceeds 100%, it means your employees are working beyond their daily capacity. Utilization above 100% can also indicate problems such as double-billing or overallocation.
What is a bad utilization rate?
A billable utilization rate of below 60% or above 90% is generally considered bad. When this rate is too low, employees are underutilized, and you’re losing revenue. When it’s too high, employees are overworked and much more likely to quit.
In terms of seniority, junior or production roles often have higher targets (sometimes up to 90%), while managers’ target rates can go as low as 60%. This is because their role requires more time for non-billable leadership and growth activities.

Research and licenses: https://creativecommons.org/licenses/by/4.0/
- Aboubakr, L., Farida, S., & Hamed, M. (2024). The Impact of Person-Job Fit on Employee Engagement. The Business and Management Review, 15.
- Cnossen, F., & Milena Nikolova. (2025). Work Meaningfulness and Effort. Journal of Behavioral and Experimental Economics, 102460–102460.