The Productivity-Pay Gap Explained (1979–2026)
Since 1979, increases in company productivity have not led to higher employee wages. This is known as the productivity-pay gap.
In this article, we’ll cover the core issues surrounding the said gap — let’s get into it.

KEY TAKEAWAYS
- The productivity-pay gap is the gap between labor productivity and employee wages.
- In theory, when productivity increases, company profits should rise, too. However, this isn’t always the case.
- The wage–productivity gap exists due to the diversity of industries — while the healthcare industry leads in earnings in 2026, farming is among the lowest-paying industries.
- Based on IMF projections and ILO’s data for 2025, Ireland is the most productive country, followed by Luxembourg and Norway.
What is the productivity-pay gap?
The productivity–pay gap is the difference between labor productivity and employee wages. In other words, it’s how much workers are producing per hour worked compared to how much they actually earn for those hours. As productivity rises, wages should rise as well.
What is productivity?
Before we discuss the relationship between productivity and median wages in more detail, we should define productivity. Different industries have different definitions, but we’re currently interested in the economics definition, which goes as follows:
Productivity is calculated as a ratio of gross domestic product per hour worked and is a measure of output per unit of input.
Simply put, productivity shows how efficiently a person completes a task. Therefore, we’re talking about a person’s productivity rate as measured on a daily basis.
For a worker to be productive, they must be motivated by internal or external factors:
- Internal factors mean a person is motivated to perform an activity for its own sake because it’s enjoyable and pleasurable to them. (The behavior itself is the reward.)
- External factors include financial incentives, public recognition, status, and others.
How does productivity affect wages?
When productivity increases, company profits increase as well — and all interested parties (should) benefit from that.
Productive workers have a stronger ability to focus and know when it’s time to take a break. In other words, their time management skills are stronger, resulting in a better work-life balance.
In the workplace, the stronger the company-level initiative and the higher the rewards, the more likely employees are to be engaged and motivated to develop their skills.
This is what should happen in practice, but that’s not always the case. The productivity-pay gap shows that high productivity doesn’t always translate into higher wages.
Let’s take a look at how the productivity vs. wages relationship has changed over time.
History of the productivity-pay gap in the US economy
Looking at the history of the US economy, the productivity-pay gap wasn’t as disproportionate as it is today. According to an Economic Policy Institute (EPI) study, between the late 1940s and 1960s, productivity and pay grew almost in parallel — workers earned higher wages as their productivity increased.
However, that gap changed a lot in the late 1970s (for various reasons, which we’ll discuss later in the text). This phenomenon, known as wage decoupling, means that since then, employee wages haven’t increased as much as their productivity has.
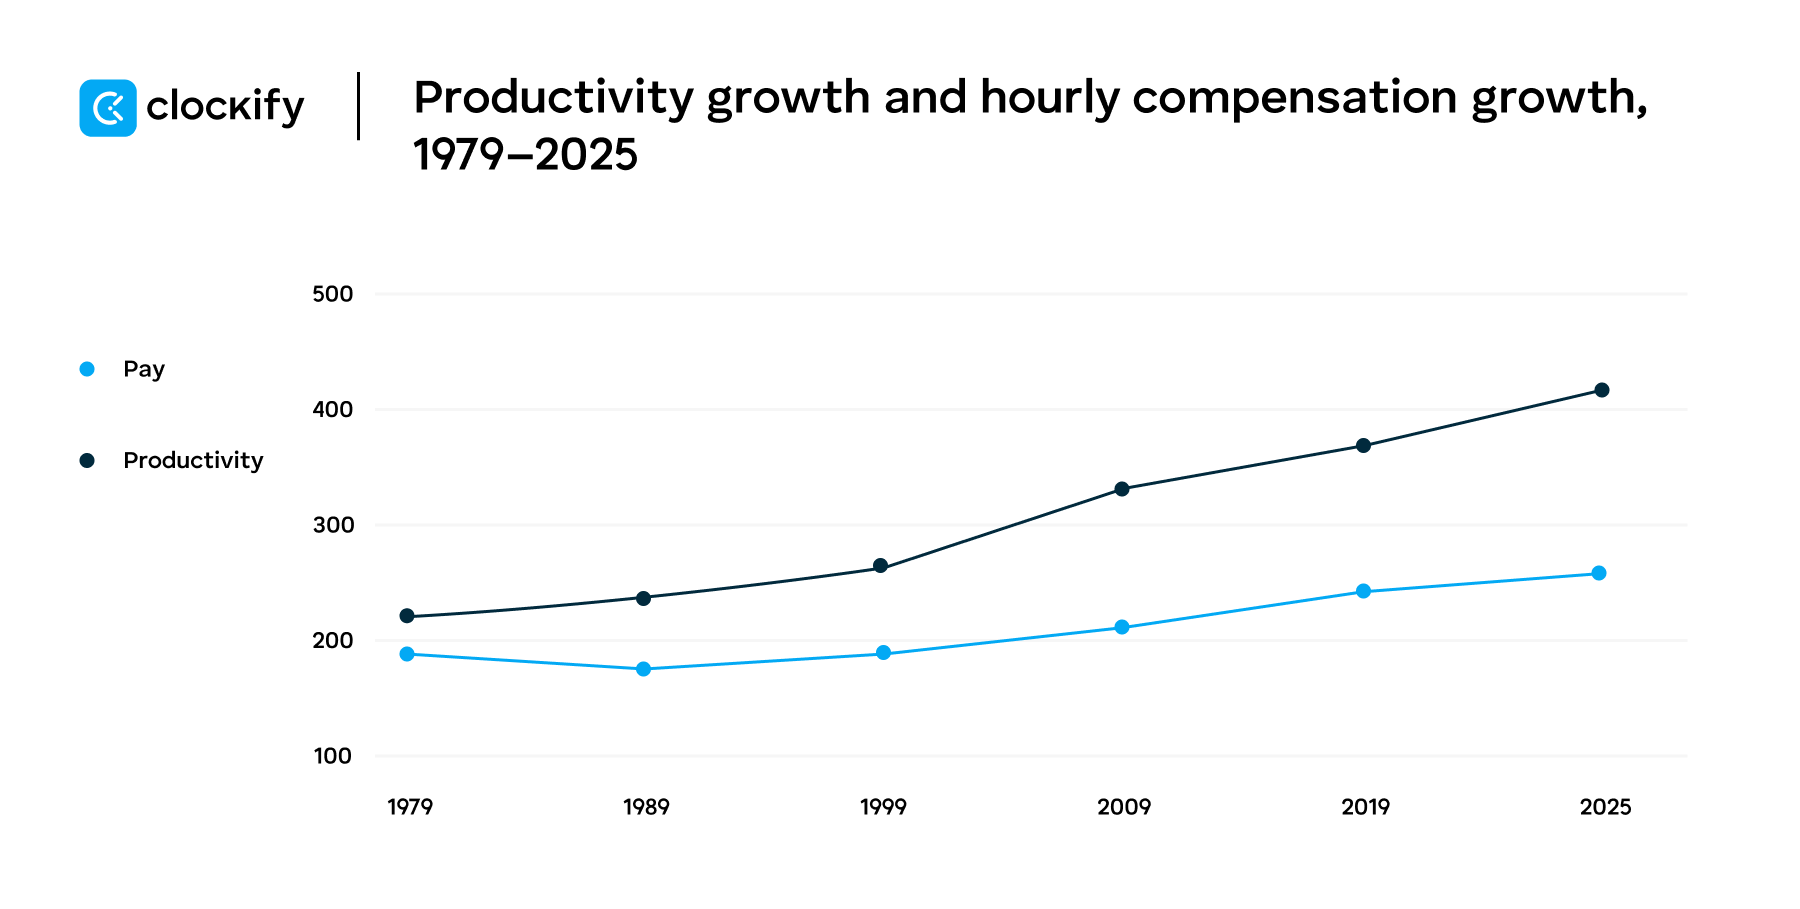
As per the latest data from EPI, productivity has grown 2.7 times more than typical worker pay since 1979. More specifically, from 1979 to 2025, productivity increased by approximately 90.2% (about 1.4% per year on average), while hourly compensation grew by only about 33% (about 0.6% per year on average).
| Year | Productivity growth rate | Hourly compensation growth |
| 1950–1959 | 32.7% | 28.2% |
| 1960–1969 | 28.1% | 22.8% |
| 1970–1979 | 14% | 8.1% |
| 1980–1989 | 11.5% | -0.6% |
| 1990–1999 | 14.4% | 6% |
| 2000–2009 | 23.4% | 12.8% |
| 2010–2019 | 10.5% | 7.1% |
| 2020–2025 | 10.5% | 5.2% |
| Total growth: 1950–2025 | 278.6% | 126.8% |
Despite rising worker productivity, workers don’t seem to receive their fair share of the benefits for their contributions. Since 1979, productivity has grown substantially, but worker compensation has remained relatively flat. The productivity vs. wages chart below clearly illustrates the growing divergence between these 2 metrics.
It would be easy to rush to conclusions and blame it all on a broken economic system where the richest are becoming richer — but bear in mind, this is only part of the reason.
Reasons for the wage–productivity gap
There isn’t a single definitive answer to why the wage-productivity gap exists, especially when considering society as a whole. So, here are some of the reasons behind the productivity-pay gap.
#1: Diversity of industries
First, the disconnect between employee productivity growth and wage growth may differ across industries.
Healthcare leads the pack for top earnings in 2026, with specialized roles hitting 6 figures. According to Indeed’s Best Jobs data, the medical field accounts for 72% of current job growth despite representing just 11% of total employment.
Tech and finance remain lucrative despite recent market corrections, with available positions consistently hitting over $100,000 a year. Interestingly, specialized transportation and trade roles are also breaking into the high-earning territory.
Farming, general transportation, and service occupations remain on the low-paying end, according to the US Bureau of Labor Statistics (BLS) Weekly Earnings Report.
#2: Technological advancement
The productivity-pay gap is shifting as companies wrestle with AI and automation.
According to the Future of Jobs Report 2025 by the World Economic Forum, 52% of employers plan to dedicate more revenue to wages by 2030, with strategies focused on matching pay to actual productivity and performance.
But there’s a catch — half of all employers plan to restructure their business around AI, and 40% expect workforce reductions where automation takes over. The report finds that 2/3s are actively hunting for talent with specific AI skills, while 85% prioritize upskilling current workers.
That said, technology isn’t closing the pay gap universally. Instead, it’s creating a divide in which workers who adapt and develop AI-related skills see their compensation rise, while those in easily automated roles face displacement.

#3: Job globalization
Globalization isn’t leveling the playing field but widening the gap instead, according to the Employment and Social Trends 2026 report by the International Labour Organization (ILO).
Wealthier countries are seeing stable job markets thanks to aging populations, while poorer nations are experiencing rapid workforce growth due to job globalization, with employment expected to jump 3.1% in 2026.
However, most of these new jobs don’t pay much and offer little security. Workers in lower-income countries aren’t becoming more productive, which means their wages stay stuck. What’s worse, the shift from informal gigs to stable, higher-paying jobs has stalled over the past 20 years. So, countries with a young, growing population can’t turn that advantage into better-paying work.
As per ILO’s predictions, productivity growth in 2026 will be uneven across the globe, meaning the pay gap is only going to be further split by geography. Rich nations continue to capture productivity gains, while developing economies add jobs without improving wages or quality of life.
🎓 How To Calculate Labor Cost + Labor Cost Calculators
#4: Declining unionization
US unionized workers used to earn higher wages as the economy prospered. Now that unions are losing power — private-sector unions fell from 35% in the 1960s to just 5.9% in 2025 — we are seeing a significant decline in unionized workers’ compensation, too.
Likewise, the latest research by the Union Membership and Coverage Database shows that the number of workers covered by a collective bargaining agreement fell from 25.7% in 1980 to 11.2% in 2025. In other words, workers whose rights (including wages) were once protected by unions are now earning lower median wages, despite productivity gains.
#5: The gig economy
According to ADP’s analysis of over 24 million workers, independent contractors earn a median of $25 an hour while temp workers pull in just $15, compared to the $23 median for all US workers. That gap widens further when you look at the averages — contractors hit nearly $39 an hour versus $19 for temps.
But pay alone doesn’t tell the whole story. Gig workers clock roughly half as many hours as traditional employees (around 85-88 hours a month vs. 155), which lowers their total monthly earnings despite competitive hourly rates.
Gig work is scaling fast, especially for contractors (up 50% since 2019), but the rewards aren’t spreading evenly, ADP concludes. Skilled specialists are thriving, while lower-paid temp workers, who make up the bulk of gig labor, have seen their market share shrink since 2023.
#6: Lack of adequate labor laws
Another big factor contributing to the productivity-pay gap is either the absence of labor policies or the infrequency with which existing ones are updated. Many of them don’t keep up with inflation or other economic conditions in their state.
Interestingly, 19 states are to get a minimum wage increase in 2026, namely:
| Total: 19 states | Maine | Nebraska | Ohio |
| Arizona | Michigan | New Jersey | Rhode Island |
| California | Minnesota | New York | Vermont |
| Colorado | Missouri | Hawaii | Virginia |
| Connecticut | Montana | South Dakota | Washington |
As a result, more workers in 2026 will live and work in states with a minimum wage of $15 than in those with the federal minimum of $7.25. But when you compare the two, the first group tops the latter by only about 10%.
However, minimum wage laws in certain states have remained unchanged for decades. For instance, Georgia’s state minimum wage is $5.15 (the lowest in the US) and has remained unchanged since 2002. The federal minimum is $7.25.
A lot has happened in the last 24 years, including financial crises, inflation, and technological advances. Still, differences in minimum wages, despite increased employee output, are another example of why the productivity-pay gap persists.
But now let's dive into the details, starting with the recent events.
The productivity-pay gap (2019–2024): A fragile fix
For the first time in decades, the productivity-pay gap is narrowing at the bottom — but the bigger picture reveals just how deep the problem runs.
Between 2019 and 2024, the lowest-paid workers saw real wages grow 15.3%, which is 7 times faster than any comparable recovery since 1979. Middle-wage workers grew 5.8%, and the gap between high and low earners shrank for the first time in over 40 years.
But, zoom out, and the gains look much thinner.
Since 1979, median wages grew just 29% — only one-third the rate of economy-wide productivity growth.
The data makes one thing painfully clear — wage growth didn’t happen on its own. During periods of tight labor markets in the US (1996–2002 and 2014–2024, when there were more job openings than available workers), median wages kept pace with productivity and grew 1.7% annually. During every other year, it was zero.
Low-wage workers told an even starker story — their wages actually fell 0.6% annually outside of tight labor markets.
The recent gains are real, but they’re fragile. They were built on pandemic-era policy decisions, state minimum wage increases, and a labor market that finally gave workers leverage.
Now, let’s see what’s been shaking up the US economy recently.
The productivity-pay gap predictions: An AI makeover
According to the Daily Caller’s article on the AI boom disrupting the US economy, AI isn’t just changing how we work; it’s also rewriting who gets paid and how much. AI hyperscaler companies (the biggest tech firms) are set to invest over $500 billion in 2026 alone, primarily in AI infrastructure, and the effects are already hitting the job market hard.
In 2025, AI was behind an estimated 54,836 job cuts in the US, with 71,825 layoffs since 2023.
Entry-level roles are disappearing fastest — former White House Chief Information Officer and high-level tech policy expert Theresa Payton warns that this could be more damaging than it appears. She said that “as AI quietly erodes entry-level opportunities in fields once rich with trial-and-error learning, we risk severing the very on-ramps that produced visionaries like Steve Jobs.”
But it’s not all bad news — AI also generated around 8,900 new jobs in 2024, with the IMF-projected US GDP growth at 2.4% in 2026, partly driven by AI efficiency gains.
However, the real issue is that AI can already replace 11.7% of the US job market, yet only 46% of workers regularly use AI, according to a Gallup survey.
Daniel Cochrane, senior research associate at the Heritage Foundation’s Center for Technology and the Human Person, says the jobs most at risk include those that are “routine or purely quantitative in nature,” as they’ll face “significant AI disruption” over the next few years.
Predictions for the US economy
As Deloitte’s latest economic forecast reveals, AI investment is the main reason the US economy looks healthy right now. Businesses poured money into data centers, software, and equipment at a pace that surprised even the economists.
Real business investment grew 7.3% in Q2 2025, after an initial estimate of just 1.9% (a big chunk of that was AI-related spending).
Information-processing equipment alone was up by more than 20% year over year. But nobody knows how long that will last. Deloitte lays out 3 scenarios for the economy through 2030:
- In the best-case scenario, AI spending continues, tariffs decline, and GDP remains strong.
- In the worst-case scenario, AI investment hits a wall in 2027 (similar to what happened after the dot-com bubble) — stock prices fall 10%, consumer spending tanks, and unemployment climbs to 5.5%.
- The baseline sits somewhere in between — GDP grows around 1.9% in 2026, inflation stays above the Federal Reserve’s 2% target until 2028, and consumer spending slows as wage growth can’t keep up.
🎓 Should We Fear AI or Embrace It?
Speaking of wages, let’s discuss the cost-of-living crisis next.
The link between the cost-of-living crisis and the productivity-pay gap
According to Resume Now’s 2025 Wage Reality Report, nearly 3 quarters of American workers can’t afford anything beyond basic living expenses, and the strain isn’t limited to low-wage jobs anymore. In fact, almost 30% of workers have moved to cheaper housing just to keep up, while 28% have taken on debt to cover everyday costs.
The root cause dates back to 2001, when China joined the WTO and US manufacturers outsourced their domestic operations to lower-cost overseas labor. An estimated 3.4 million factory jobs vanished, and the middle-wage anchor that once kept service costs manageable disappeared with them.
Sure, consumer goods got cheaper — TVs, clothing, electronics. But the things you actually need to live kept getting more expensive, and wages stopped keeping pace. People are living paycheck to paycheck just to cover the necessities, CNN’s article explains.
Corporate profits tell the other side of the story, according to the Federal Reserve — they jumped from under 6% of GDP in 2000 to 11% by 2024. Even though median wages rose about 13% over the same period, this growth was largely driven by the tech, business, and finance sectors, while manufacturing wages fell behind.
Why essential services keep getting more expensive
In the 1960s, economist William Baumol identified what’s now called Baumol’s cost disease — the idea that labor-intensive services like healthcare, education, and childcare can never become as productive as manufacturing.
This concept assumes that it still takes roughly the same amount of time to teach a class or treat a patient as it did 60 years ago. But the people doing that work still need to be paid competitively, which means their wages have to keep up with what they could earn in higher-paying fields like tech or finance.
The reason costs of essential services keep climbing isn’t due to reduced efficiency, but because the economy forces them to. In that sense, Baumol’s cost disease itself is not the issue — this cost squeeze only becomes uncomfortable when wage growth is concentrated at the top of the earning pyramid.
Simply put, when broad-based wages rise with productivity, households can absorb higher service costs. When they don’t, like now, essential services start pricing out the middle class.
As of December 2025, the Consumer Price Index (CPI) for all items rose 2.7%, with just the food index increasing 3.1% over the year. During the same period, the medical care services index jumped by 3.5%.
Americans are paying prices set by the highest-earning parts of the economy, while paychecks reflect none of that productivity or purchasing power. That said, let’s talk about the wealth concentration in the top 10%.
Wealth concentration: The wealthy keep getting wealthier
Despite a pandemic, inflation spikes, and rising interest rates, the rich have gotten a lot richer since 2020.
According to the latest Visa Business and Economic Insights (VBEI) analysis, the wealth threshold to reach the top 10% of US households jumped from $1.3 million in 2020 to $1.8 million in 2024 — a 40% increase. The income threshold climbed too, going from $170,000 to $210,000, a 23% jump.
For context, the US median income in 2024 was just $83,730. The gains came almost entirely from rising home and stock prices, not paychecks.
Homeowners and investors benefited as the housing market surged starting in 2020 and major stock indexes rebounded fast from the pandemic crash, hitting new highs. The top 10% of Americans hold over 87% of corporate equities and mutual fund assets, and their value has exploded.
To make an even starker comparison, let’s see the growth of average wages for the highest- and lowest-earning workers, based on an EPI analysis on wage inequality.
| Year | Average wage of the highest earners | Average wage of the lowest earners |
| 1979 | $281,932 | $29,953 |
| 2023 | $794,129 | $43,035 |
| Total growth 1979–2023 | 181.7% | 43.7% |
Not only was growth uneven, but the highest earners earned more than 18 times the wages of the lowest earners in 2023.
Meanwhile, wages grew, but at about half the pace of wealth. Said Visa analysis states that about 12.2 million US households (out of 135 million in 2025, with 2.53 persons per household on average) now qualify as “affluent” — defined as earning at least $210,000 or having a net worth of around $1.8 million. Regional thresholds in the US vary by cost of living.
Generationally, this is divided across:
- Gen X — 57%
- Gen Z and Millennials — 31%
- Boomers — 12%
In that sense, the productivity-pay gap has begun to extend beyond stagnant wages to include wealth accumulation. But the gap doesn’t stop there, since the worker’s income share hit a new low.
Labor share of income hit the lowest point ever recorded
Even though the economy is producing more wealth, less of it is going to employee pay and benefits, while more is going to corporate profits and investors.
When the Bureau of Labor Statistics first started tracking this data in 1947, workers received 70% of the nation’s total income. By the third quarter of 2025, the labor share of income had dropped to its lowest level in 78 years — 53.8%, according to Prospect’s article on labor income.
So, over the last 8 decades, the workers’ share of the economy has shrunk by about 16% while the same amount shifted directly into the pockets of investors and business owners. The growing trend of value-based pricing — charging based on perceived value rather than production costs — (especially in the SaaS industry) contributes to this, too.
And let’s not forget about the monopsony power in the labor market — that’s up next.
Why companies get away with paying workers less than they’re worth
Ever wonder why so many companies seem to underpay their workers? Economists call it monopsony power — the ability of firms to set wages below what workers actually produce.
A recent paper from the Federal Reserve Bank of Dallas offers a fresh take — it all comes down to information (not just job search costs or job preferences).
Workers don’t know everything about available jobs, and firms don’t know everything about potential hires. So, both sides make strategic guesses about where to invest their effort. This creates information friction that lets companies hold wages down.
Even moderate information frictions can produce wage markdowns of 30–40% below what workers actually contribute in output, according to the said paper.
Also, while matching high-skilled workers with high-productivity firms increases output, it also increases monopsony power by reducing wage competition. For example, Silicon Valley tech firms have access to a concentrated pool of specialized workers who have few outside options.
More competitive wages emerge when firm-worker matching is less targeted, meaning firms expand their pool of potential workers across varying skill and knowledge levels. This isn’t always the most efficient for total output, but it’s fairer in how income gets distributed.
In that sense, companies’ wage-setting power doesn’t solely depend on supply and demand, but also on:
- Competition,
- Market tightness,
- Screening bottlenecks,
- Sorting patterns, and
- Related factors.
Now, let’s discuss another important distinction in the productivity-pay gap — gender.
The gender wage gap got worse
ADP Research’s People at Work 2025: A Global Workforce View report found that 28% of women believe they are paid unfairly compared to 23% of men. That’s not surprising, considering that the gender wage gap widened sharply in 2024, hitting its worst level in nearly a decade, analysis by the Institute for Women’s Policy Research finds.
Namely, women who worked full-time year-round earned just 80.9 cents for every dollar men made — down from 82.7 cents in 2023 and 84 cents in 2022.
That’s the biggest single-year drop in the earnings ratio since 1966 — while, over the past 2 years, men’s earnings climbed 3.7%.
Moreover, there are other discriminatory factors impacting the gender pay gap, like age, race, and education.
The same analysis shows that Latinas are among the lowest-paid women workers, earning $33,620 less than caucasian men in 2024 (58 cents on the dollar). Women of color made $28,340 less — 64.6 cents per dollar.
It also appears that women’s educational attainment has exceeded men’s in the US, while the wage gap will continue to linger. In fact, 2025 US Census Bureau data show that 40.1% of women aged 25+ had a bachelor’s degree or higher, compared with 37.1% of men.
The BLS report on weekly earnings found that among college graduates with advanced degrees, the top 10% of male workers earned $4,949 or more per week, while their female counterparts earned $3,510 or more.
Objectively, there’s no room for this kind of discrimination in the modern age, as women are just as valuable as men. This is especially true for working mothers, whose responsibilities require strong time-management skills.
The truth is out there: the productivity-pay gap exists, regardless of the educational attainment women achieve. Still, closing the gender wage gap could promote fairness and increase economic productivity.
Let’s now take a look at the productivity-pay gap on a global scale.
The productivity–pay gap by country
Different countries focus on different industries, which, as we've mentioned, can be another reason for the gap.
Aside from other geopolitical factors, variation in the average number of hours worked by country also affects the pay-productivity gap.
For example, full-time employees in the US still work more hours per year than full-time employees in Europe. That said, the norm for the workweek in the US is 40 hours, while it’s 35 hours in France.
If we didn’t consider any other factors, the logical conclusion would be that people in Europe are more productive. But of course, it's not nearly as simple as that.
Beyond measuring individual and team productivity, you can also measure a country’s productivity. If you’re wondering how to do just that, the answer lies in:
- Gross Domestic Product (GDP) — the monetary value of goods and services within a certain country (a nation's total economic output), while GDP per capita divides that total by the population, and
- GDP per hour worked — shows how much money workers (labor productivity) contribute to the country’s economy per hour.

The top 10 most productive countries
The list you see below reflects GDP per hour worked (used for our ranking) and GDP per capita, along with annual work hours, based on IMF projections and ILO’s data for 2025.
| Rank | Country | GDP per hour worked (USD) | GDP per capita (USD) | Average hours worked (per year) |
| 1. | Ireland | $164.7 | $147,878 | 1,851h |
| 2. | Luxembourg | $159.5 | $152,395 | 1,851h |
| 3. | Norway | $125.6 | $106,694 | 1,752h |
| 4. | Singapore | $100.4 | $156,969 | 2,215h |
| 5. | Guyana | $99.6 | $94,189 | 2,324h |
| 6. | Netherlands | $92.3 | $84,035 | 1,643h |
| 7. | Denmark | $92.2 | $84,763 | 1,763h |
| 8. | Belgium | $91.5 | $75,882 | 1,820h |
| 9. | Austria | $86.7 | $74,852 | 1,732h |
| 10. | Switzerland | $85.8 | $97,659 | 1,856h |
Here we see insights into the productivity–pay gap beyond just the US perspective. Productivity doesn’t always result in higher wages — even the countries with the highest productivity per hour (Ireland and Luxembourg) don’t have equal wage distribution.
In terms of GDP, the US ranks 1st globally at $30.62 trillion. However, GDP per capita in the US is $89,599 while GDP per hour worked, for annual average working hours of 1,976 hours is $81.8. In other words, productivity vs. wage distribution is still very disproportionate.
We conclude that this disproportion is a relatively widespread issue, more pronounced in some countries than others. Factors such as labor laws, economic structures, and dominant economic sectors, and similar factors, also play a critical role in how profit is shared.
Economic and policy implications of the productivity–pay gap
Last but not least, we want to devote this section to the effects of the productivity-pay gap on the economy and government policy.
Economic implications
The phenomenon of high productivity and still wages can have far-reaching effects on the economy. Here are some of the implications:
- Poor living standards — when workers experience stagnant wages, their purchasing power also declines over time. They can’t keep up with the prices, resulting in poorer living standards.
- Slow economic growth — if the said workers experience stagnant wages and their purchasing power drops, this trend can affect the whole economy of a country. Since consumption is a major portion of the US economy, consumer spending on goods and services accounted for 69% of GDP growth in 2025’s third quarter. Therefore, low consumption would also result in economic decline.
- Wage inequality — as mentioned above, the productivity-pay gap can also lead to wage disparities that benefit higher-income workers more.
- Increased government budget spending — when workers’ wages remain unchanged for a long period of time, these workers turn to public social programs more often, such as cash assistance, health insurance, housing subsidies, etc. As a result, a country’s budget shrinks, bringing higher taxes and debt, too.
Policy implications
Beyond economic implications, the productivity-pay gap can affect government policies and regulations. Here are some of them:
- Minimum wage — the gap between productivity and wages may also result from a country’s stagnant minimum wage, which is not adjusted to inflation to ensure fair compensation. Namely, the federal minimum wage in the US has been $7.25 since 2009. While some states adopted the federal minimum as their state minimum wage, other states adjust it periodically, as is the case with California minimum wage (from $16/hour in 2024 to $16.90/hour in 2026).
- Progressive taxes — when an employee’s income increases, their tax rates increase. At the same time, if an employee earns less, their income tax rates are lower. So, progressive taxes can help reduce the productivity–wage gap. Since top earners pay higher taxes, that income can be used to fund public services and programs, benefiting the broader workforce as well.
- Exploiting low-wage workers — workers in service industries or manufacturing often don’t benefit from productivity growth but instead work more, hinder their work-life balance, and are paid the same.
- Labor unions — anti-union practices and a lack of union rights also impact the huge gap between productivity and wages. We’ve discussed how this trend lowers the hourly wage of a typical worker in the US, but countries like Belgium and Austria have lower wage inequality due to higher union membership rates. The US can look to them, as up to 98% of Austrian workers are covered by collective bargaining agreements, contributing to more equal wage distribution.
- High top-earner wages — we’ve already discussed how top earners earn a staggering 18 times more than typical workers in the US, creating an enormous gap in wage distribution.
The productivity-pay gap significantly affects both the economy and government policy in the US. From an economic perspective, it contributes to income inequality, low purchasing power, and economic decline. From a policy perspective, it may call for higher wages and increased labor rights.
Reducing the gap between wages and productivity may benefit both a country’s economic stability and stronger labor protections.
FAQs about productivity vs. wages gap
Still interested in learning more about productivity growth and its effect on wages? Then check out the following section.
What does the productivity gap mean?
The productivity gap is the difference in output per worker or per hour worked across companies, industries, or countries. It can also refer to the divergence between the value workers create (productivity) and their compensation (pay).
In a global context, the productivity gap refers to the difference in efficiency between leading economies (such as the US) and others. For instance, US productivity growth has consistently outpaced that of Europe in recent decades.
Namely, over the last 25 years, US labor productivity grew at an average rate of 1.7% per year, while the EU managed just 1%, the European Employers’ Institute reveals. The gap began wide in the mid-1990s — the EU was already 27% behind the US — and it has only widened. By 2024, EU real labor productivity sat 38% below the US level.
Are MFP and TFP the same?
MFP (multifactor productivity) and TFP (total factor productivity) both measure the same thing — the efficiency with which all inputs (labor and capital combined) are used in production. In that sense, they’re often used interchangeably. However, they may differ in their methodology.
How is MFP calculated?
MFP is calculated as:
MFP Growth = Output Growth - (Labor Share x Labor Input Growth) - (Capital Share x Capital Input Growth)
This is how it captures productivity gains from innovation and efficiency improvements.
What are the 3 Ps of economic growth?
The 3 Ps of economic growth are:
- Population — the size and growth rate of the workforce,
- Participation — the percentage of the population actively working or seeking work (labor force participation rate), and
- Productivity — output per worker or per hour worked.
How much does productivity compare to wages in Europe?
The productivity-pay gap is a global issue affecting workers worldwide. According to the European Commission’s Labour Market and Wage Developments report from 2025, real wages in the EU bounced back in 2024 with a 2.7% increase, but they remain slightly below pre-COVID-19 levels — 0.7%.
The same report says that in 2024, labor productivity per hour worked in the EU increased by only 0.4%, while GDP per capita rose by 0.7%. However, wage growth has been held back by low productivity growth, economic uncertainty, and less-tight labor markets. Also, the situation varies significantly across EU member states.
Does higher productivity lead to higher wages?
In theory — yes, higher productivity should lead to higher wages. However, as we’ve seen, the productivity-pay gap shows that since 1979, productivity has grown 8 times faster than typical worker pay, indicating that increased productivity doesn’t automatically translate to higher wages.
What are the 4 determinants of productivity?
The 4 main determinants of productivity are:
- Physical capital — the tools, machinery, technology, and infrastructure workers use to produce goods and services (capital deepening).
- Human capital — the education, skills, training, and experience of the workforce.
- Natural resources — the availability and quality of land, minerals, energy, and other resources used in production.
- Technological knowledge — innovation, research and development, and improvements in production methods and processes.
🎓 10 Fast Ways to Improve Employee Productivity in the Workplace
How can employers reduce the productivity-pay gap within their organization?
We have already established that the productivity-pay gap arises from various factors, including government policies and regulations.
At the organizational level, some employers are trying to reduce the gap on their end. Here’s what some are doing.
#1: Set clear KPIs
KPIs (Key Performance Indicators) are measurable metrics that showcase employees’ effectiveness in achieving their objectives over a defined period.
Not all companies have set explicit KPIs at the individual level. That can be a major issue when determining who’s a high achiever and who isn’t.
So, the first step for employers in reducing the productivity-pay gap in their own company should be to create KPIs.
#2: Track and monitor performance
In addition to setting up KPIs, employers should actively monitor employee performance and output.
To do so, companies can use time-tracking apps like Clockify by CAKE.com that track how productively employees spend their work hours.
Beyond tracking performance, time-tracking apps help ensure all employees are paid fairly.
#3: Offer competitive wages
When you measure performance effectively, you can also pay competitive wages.
If an employee meets (or exceeds) their set KPI goals, it’s only fair that they’re rewarded for their contributions and performance.
In turn, the employer is ensuring fair pay while improving morale and job satisfaction in the workplace.
🎓 Best Time Tracking Apps for 2025: Reviewed & Compared
Bridge the productivity-pay gap with Clockify by CAKE.com
The most reliable way to determine an employee’s fair compensation is to track their working hours and the tasks they perform.
With Clockify, you get complete visibility into how your team spends their time — and what they accomplish.
Here’s how Clockify helps solve the productivity-pay gap in your organization:
- Track productive time, not just attendance — employees track time on specific tasks and projects with a single click, while reports show you who’s consistently delivering.
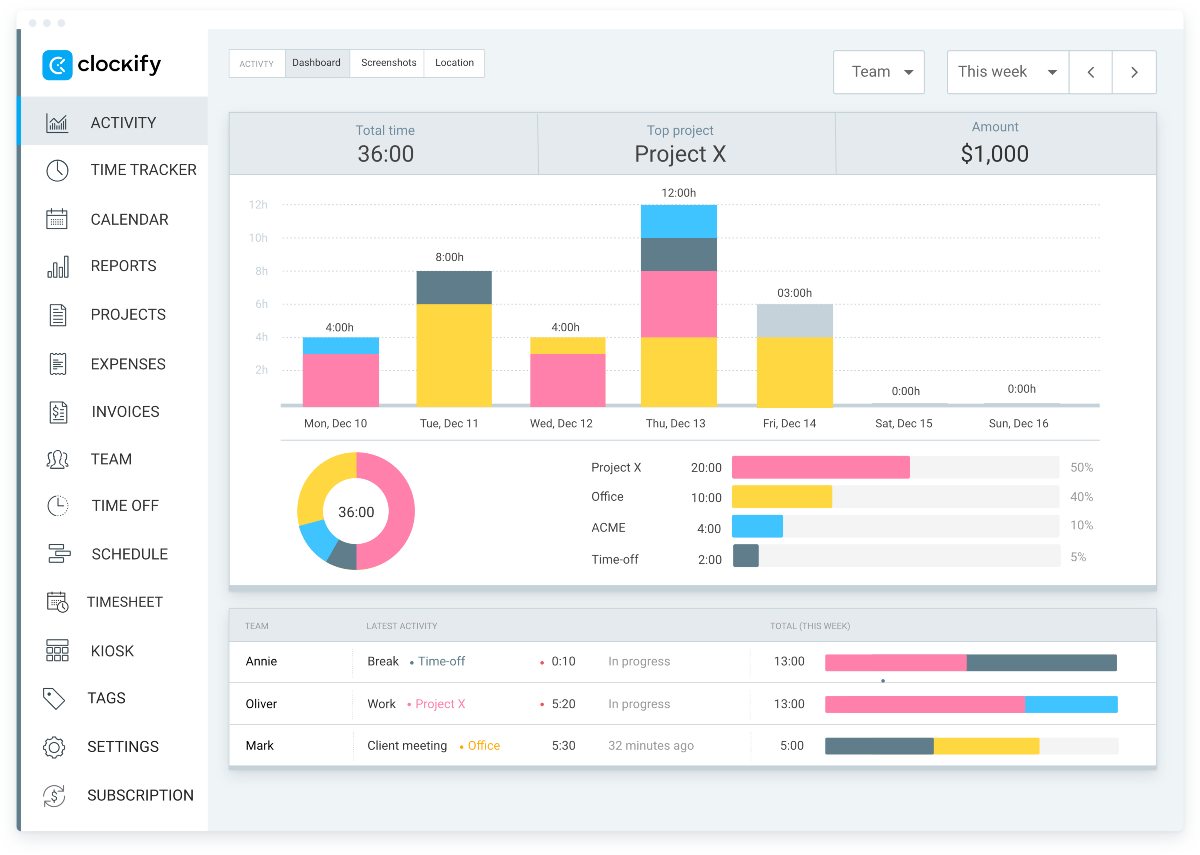
- Verify every billable hour — detailed time logs show exactly when work happened and what was done. You only pay for work you can verify, so no more inflated contractor invoices or questionable overtime.
- Automate payroll management — Clockify automatically calculates hours worked, applies hourly rates, factors in overtime, and generates payroll-ready reports.
- Stay compliant with labor laws — automatic tracking of breaks, overtime, and work hours ensures compliance without constant manual monitoring.
- Identify and reward high performers — productivity reports reveal which employees deliver the most value, giving you concrete data to justify raises and bonuses for your top performers.
Break the chain of the productivity-pay gap and ensure fair pay across your organization.